
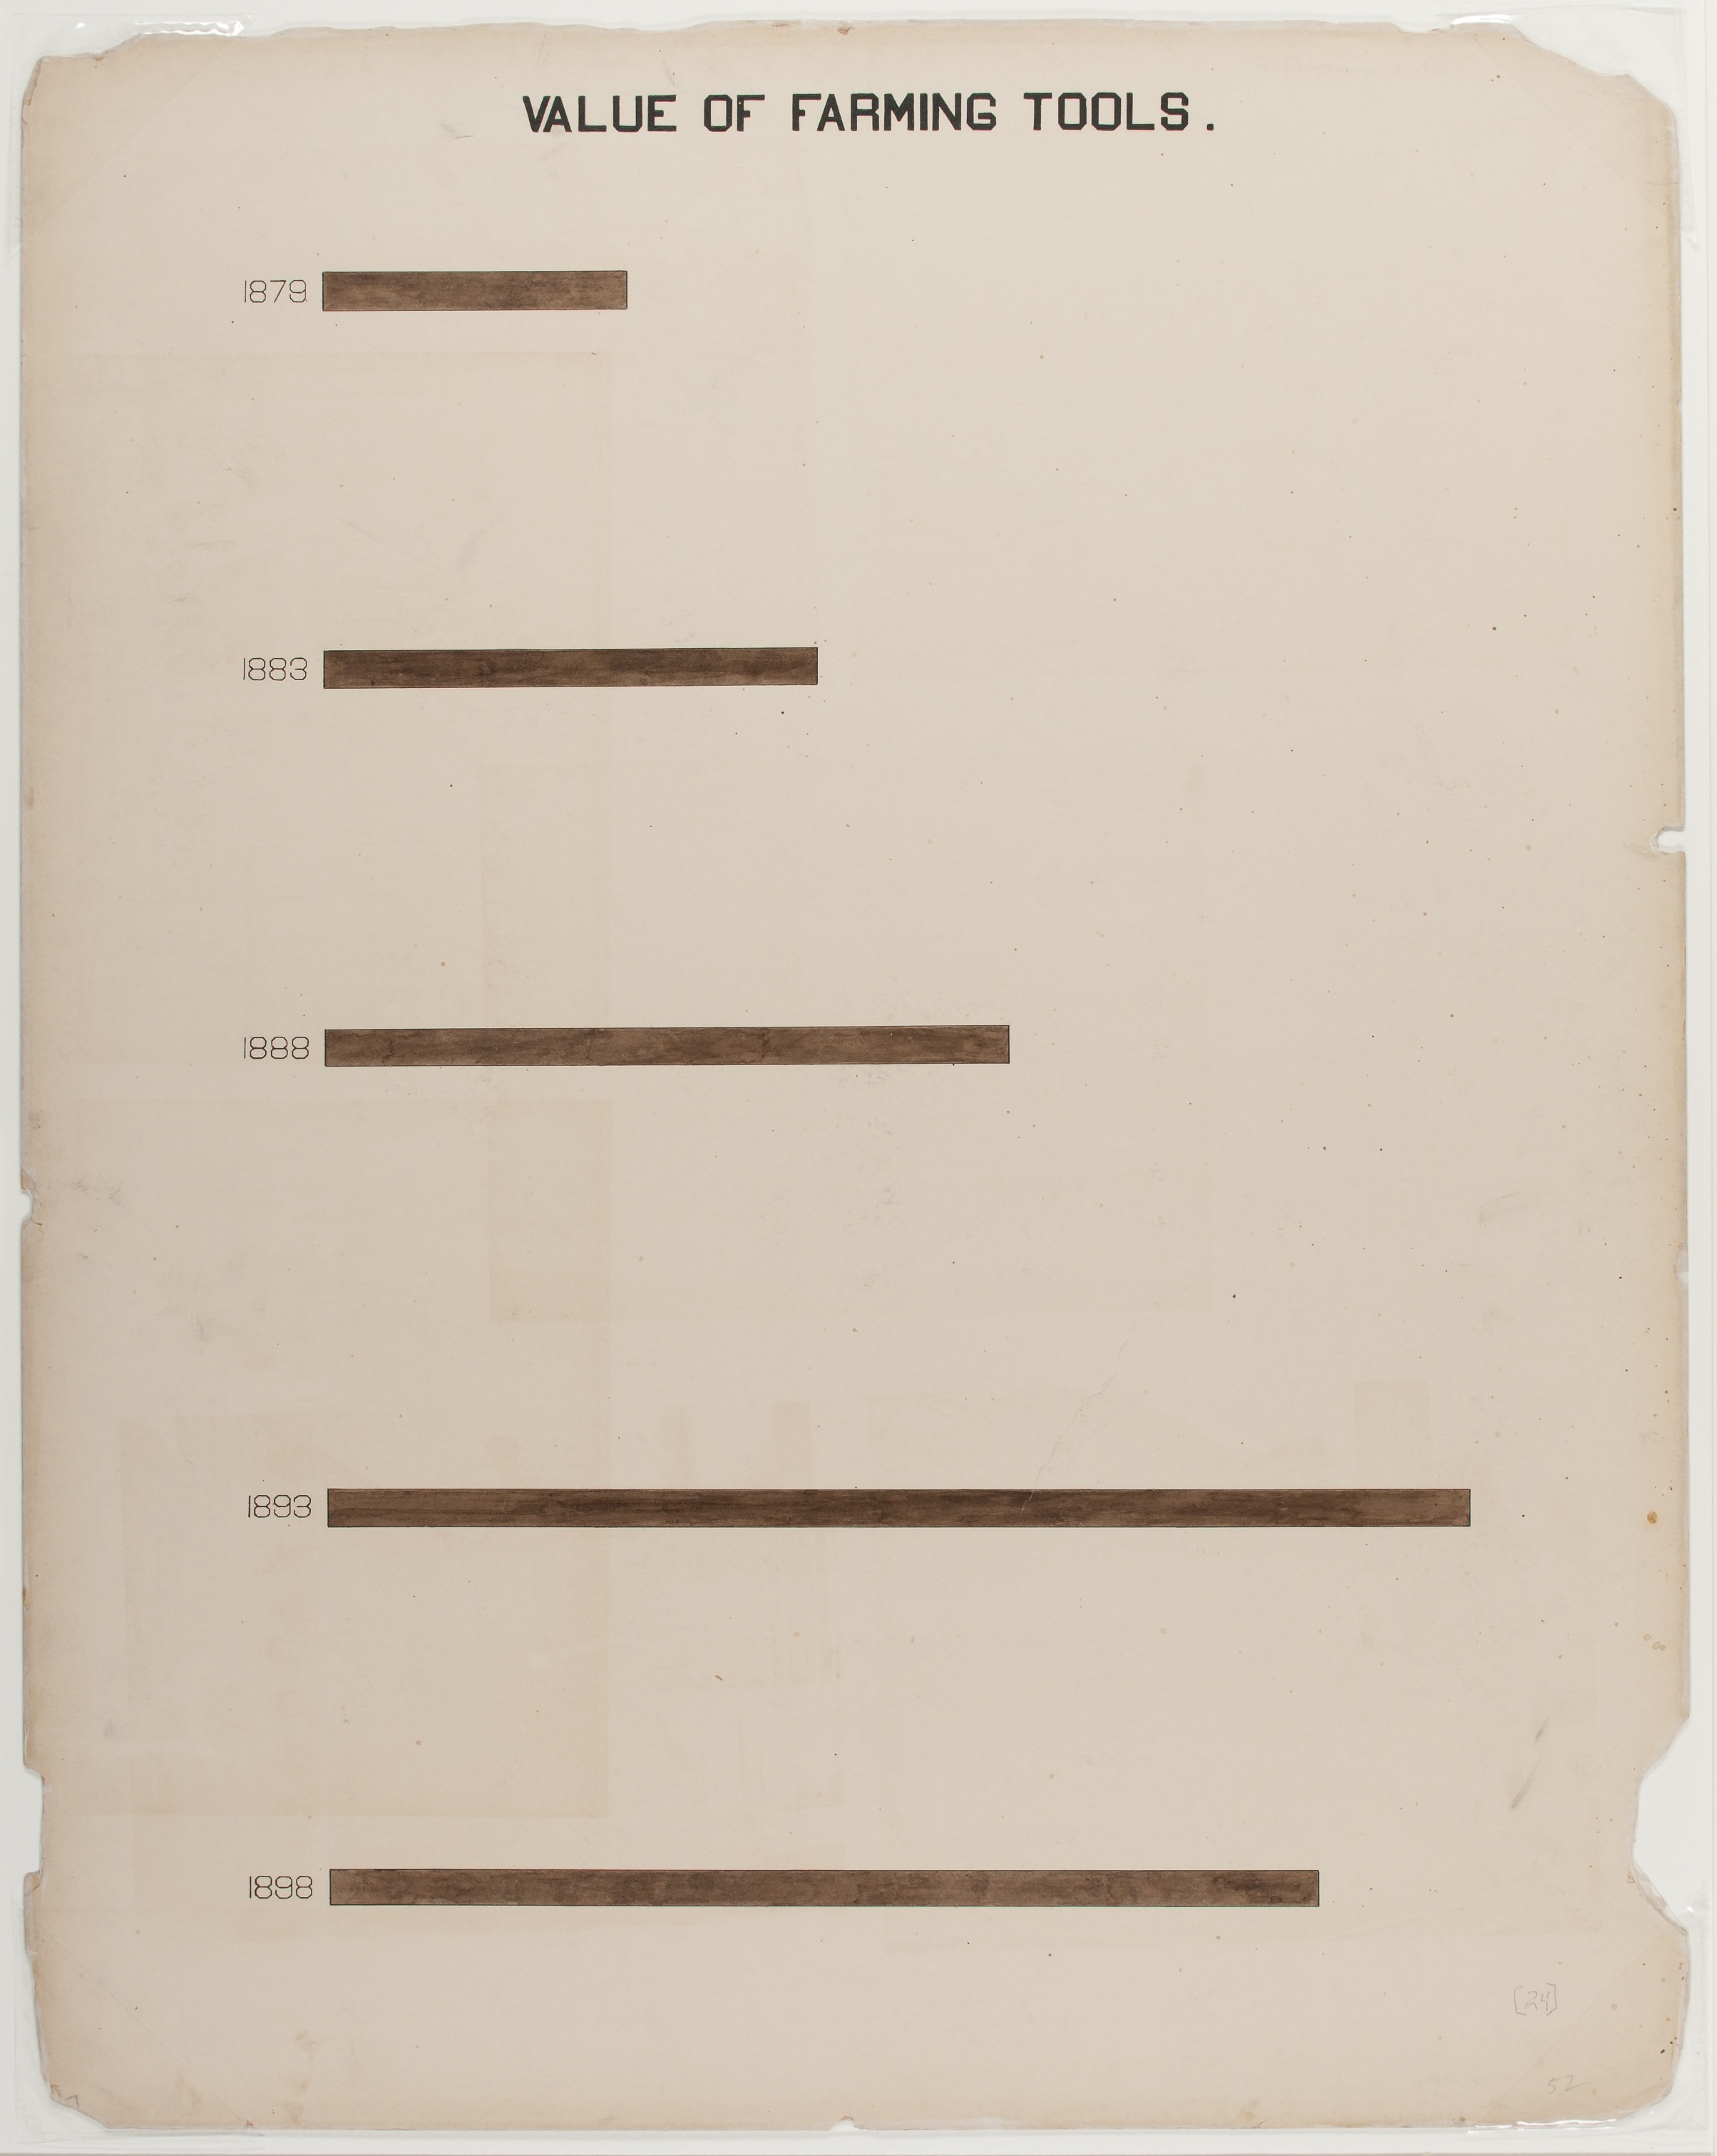
The Georgia Negro: A Social Study - Bar graph shows value of farming tools between 1879 and 1898 [LCCN2013650444]
The pattern
This still is filed under Data as proof.
Define
A chart, map, or count that is the argument, not an illustration next to the argument.
Mechanism
Sighted evidence. The reader is asked to believe their eyes: a bar, a share, a spread on a map.
Verdict
The claim is comparative or quantitative and the figure can be read without a caption doing the sell.
Why it works
Every number has been deleted. What is left is a shape, and because the bars are separated by huge vertical gaps the reader cannot scan them as a table - they have to be compared one at a time, as five moments rather than a series. The unequal spacing and the missing axis also quietly hide the dip at the end, so the plate reads as accumulation even though the last bar is shorter than the one before it, which is the honest thing to notice when stealing this layout.
Steal this when
Use it when the direction of travel matters more than the magnitudes and you have one page to establish momentum before the detailed charts arrive. Check the final data point before you copy it, because this structure flatters a trend that has already turned.