
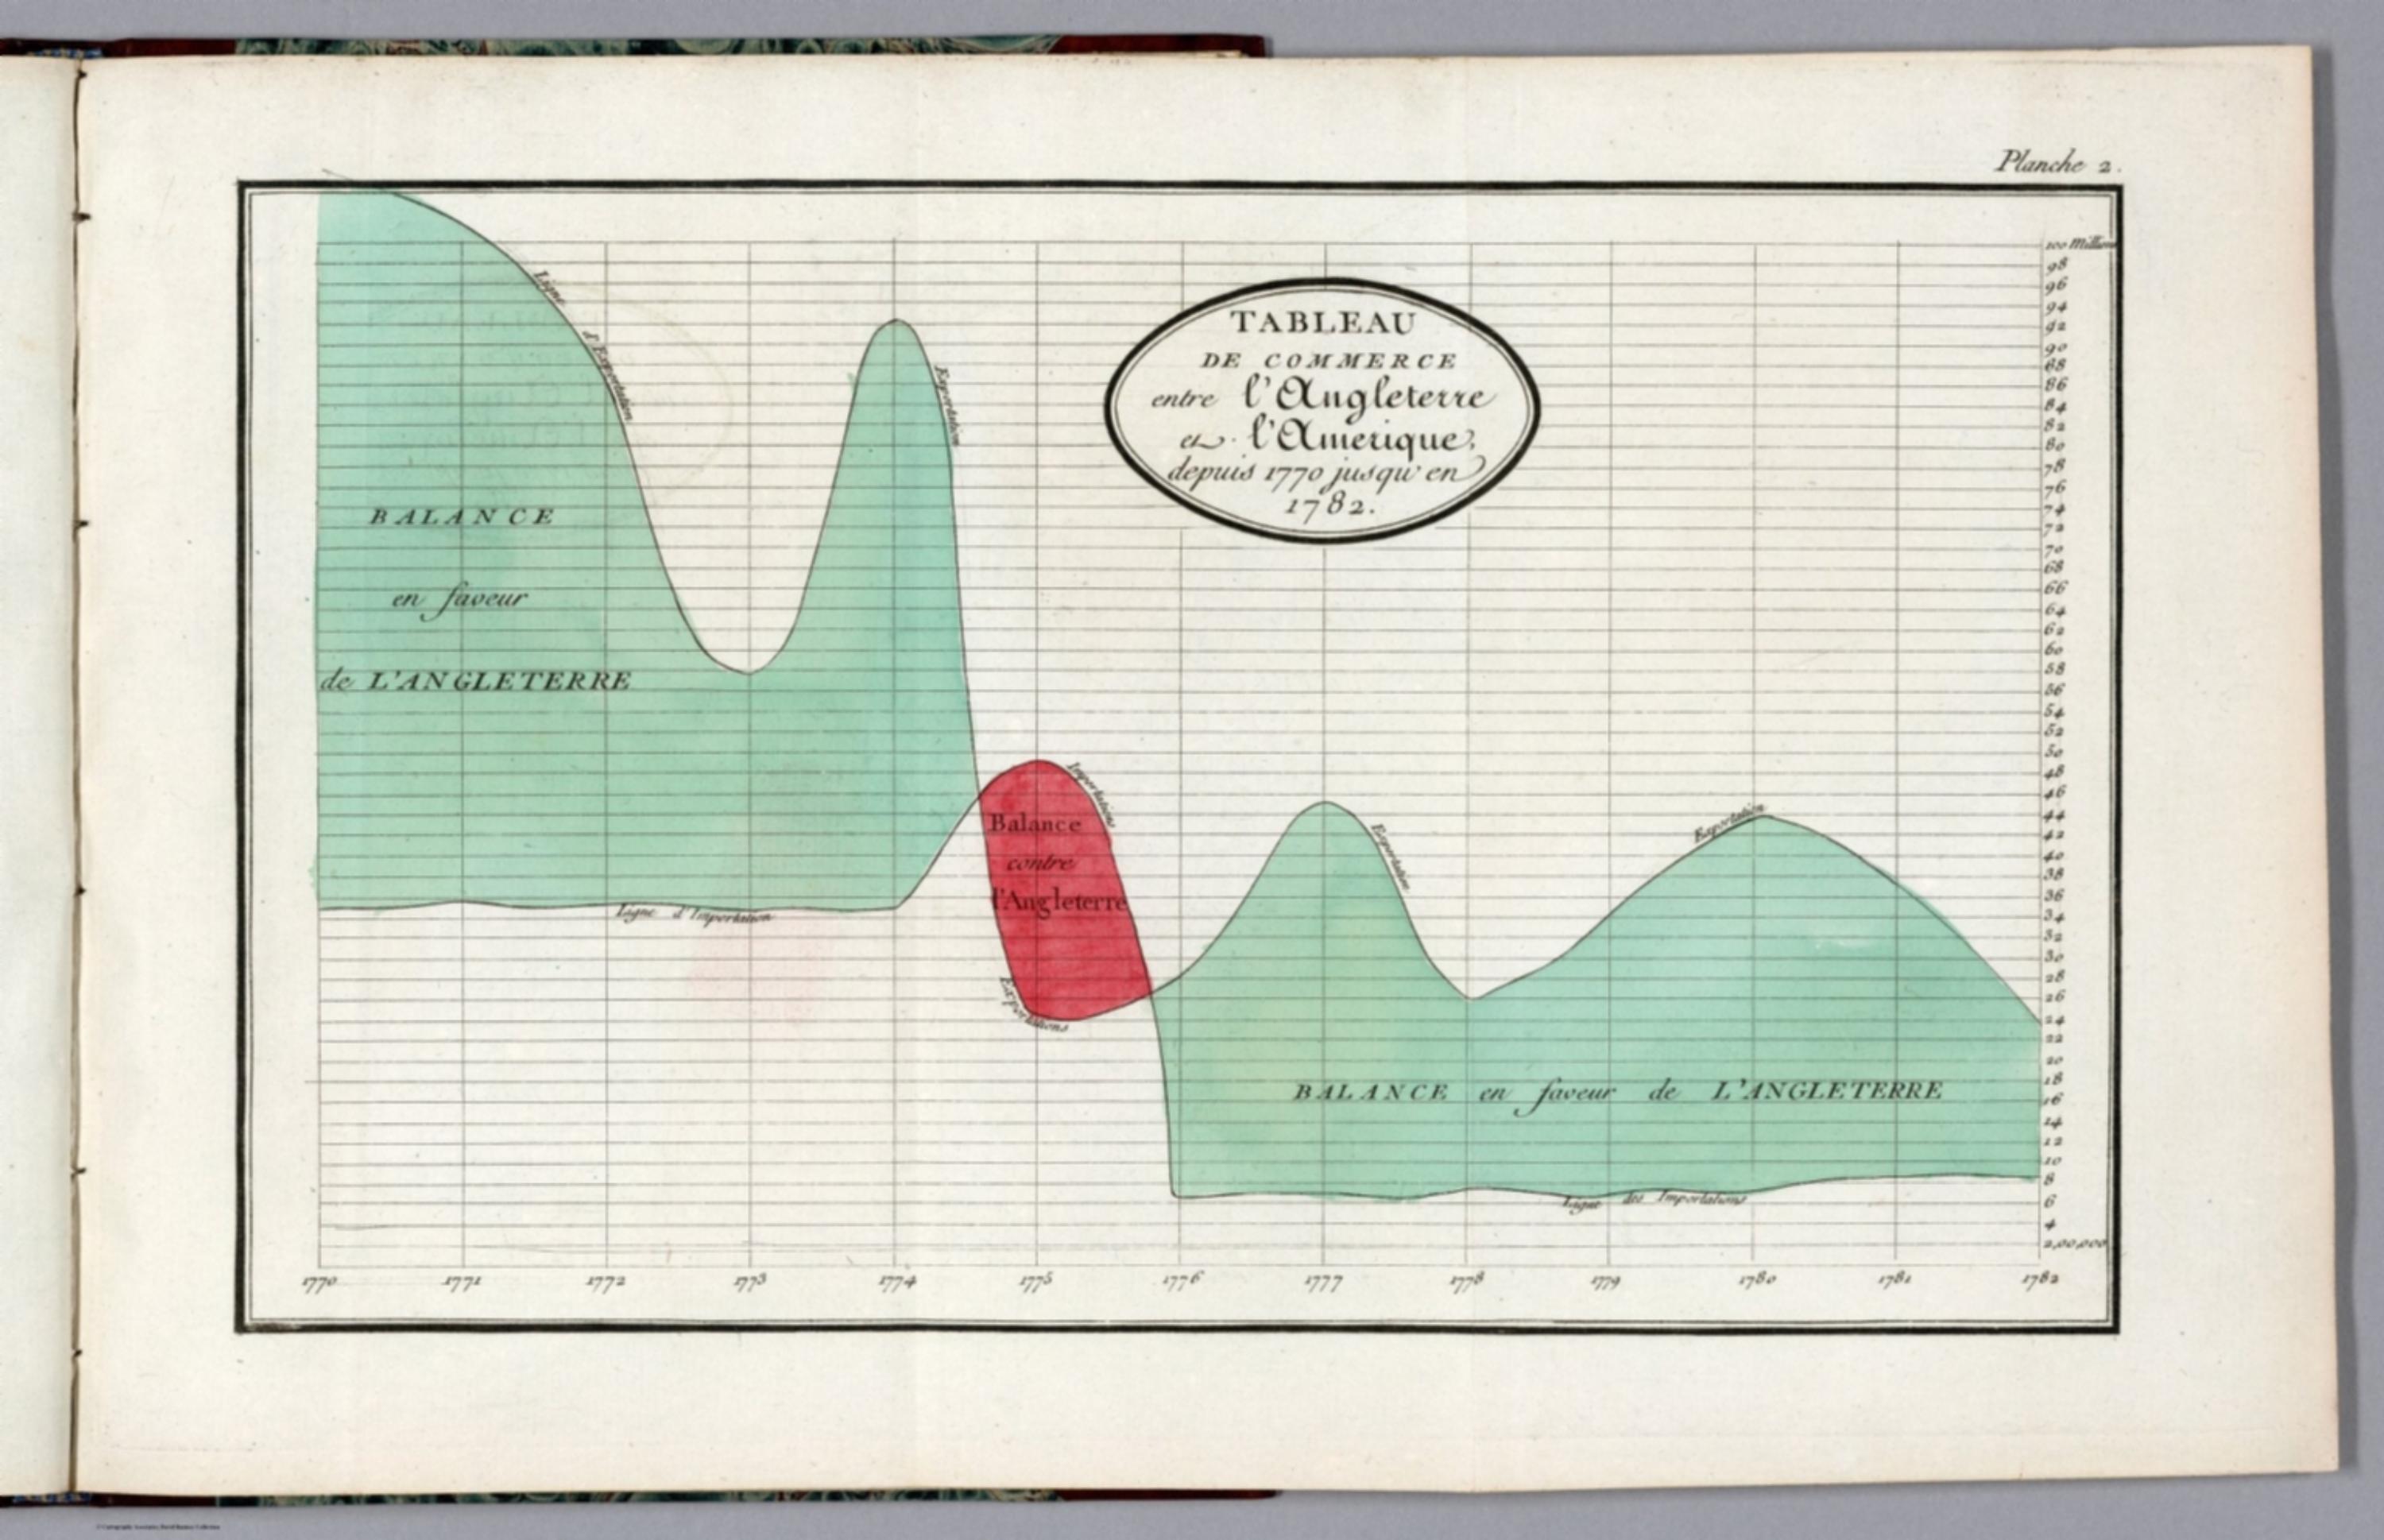
Tableaux d'arithmetique lineaire (French edition of the Commercial and Political Atlas) - Tableau du commerce entre l'Angleterre et l'Amérique, depuis 1700 jusqu'en 1782 [14319.055]
The pattern
This still is filed under Data as proof.
Define
A chart, map, or count that is the argument, not an illustration next to the argument.
Mechanism
Sighted evidence. The reader is asked to believe their eyes: a bar, a share, a spread on a map.
Verdict
The claim is comparative or quantitative and the figure can be read without a caption doing the sell.
Why it works
The subject of the chart is the gap, not either line, so Playfair fills the gap and writes the name of the quantity inside it, turning a derived figure into an object the eye can hold. When the lines cross, the fill changes colour and takes a different label, so the reversal announces itself without an annotation or an arrow: red against, green in favour, one crossing, one date. The horizontal hatching inside the green stops the fill reading as decoration and keeps it reading as a measured quantity. Covering only thirteen years at full plate width is the decision that makes it work at all, because a single year's swing stays visible instead of being compressed into a trend.
Steal this when
Use it when the story is the gap between two series and the moment it flips. Fill the gap, label it in place, switch colour at the crossing, and give the period enough width that one period's move is still readable.