
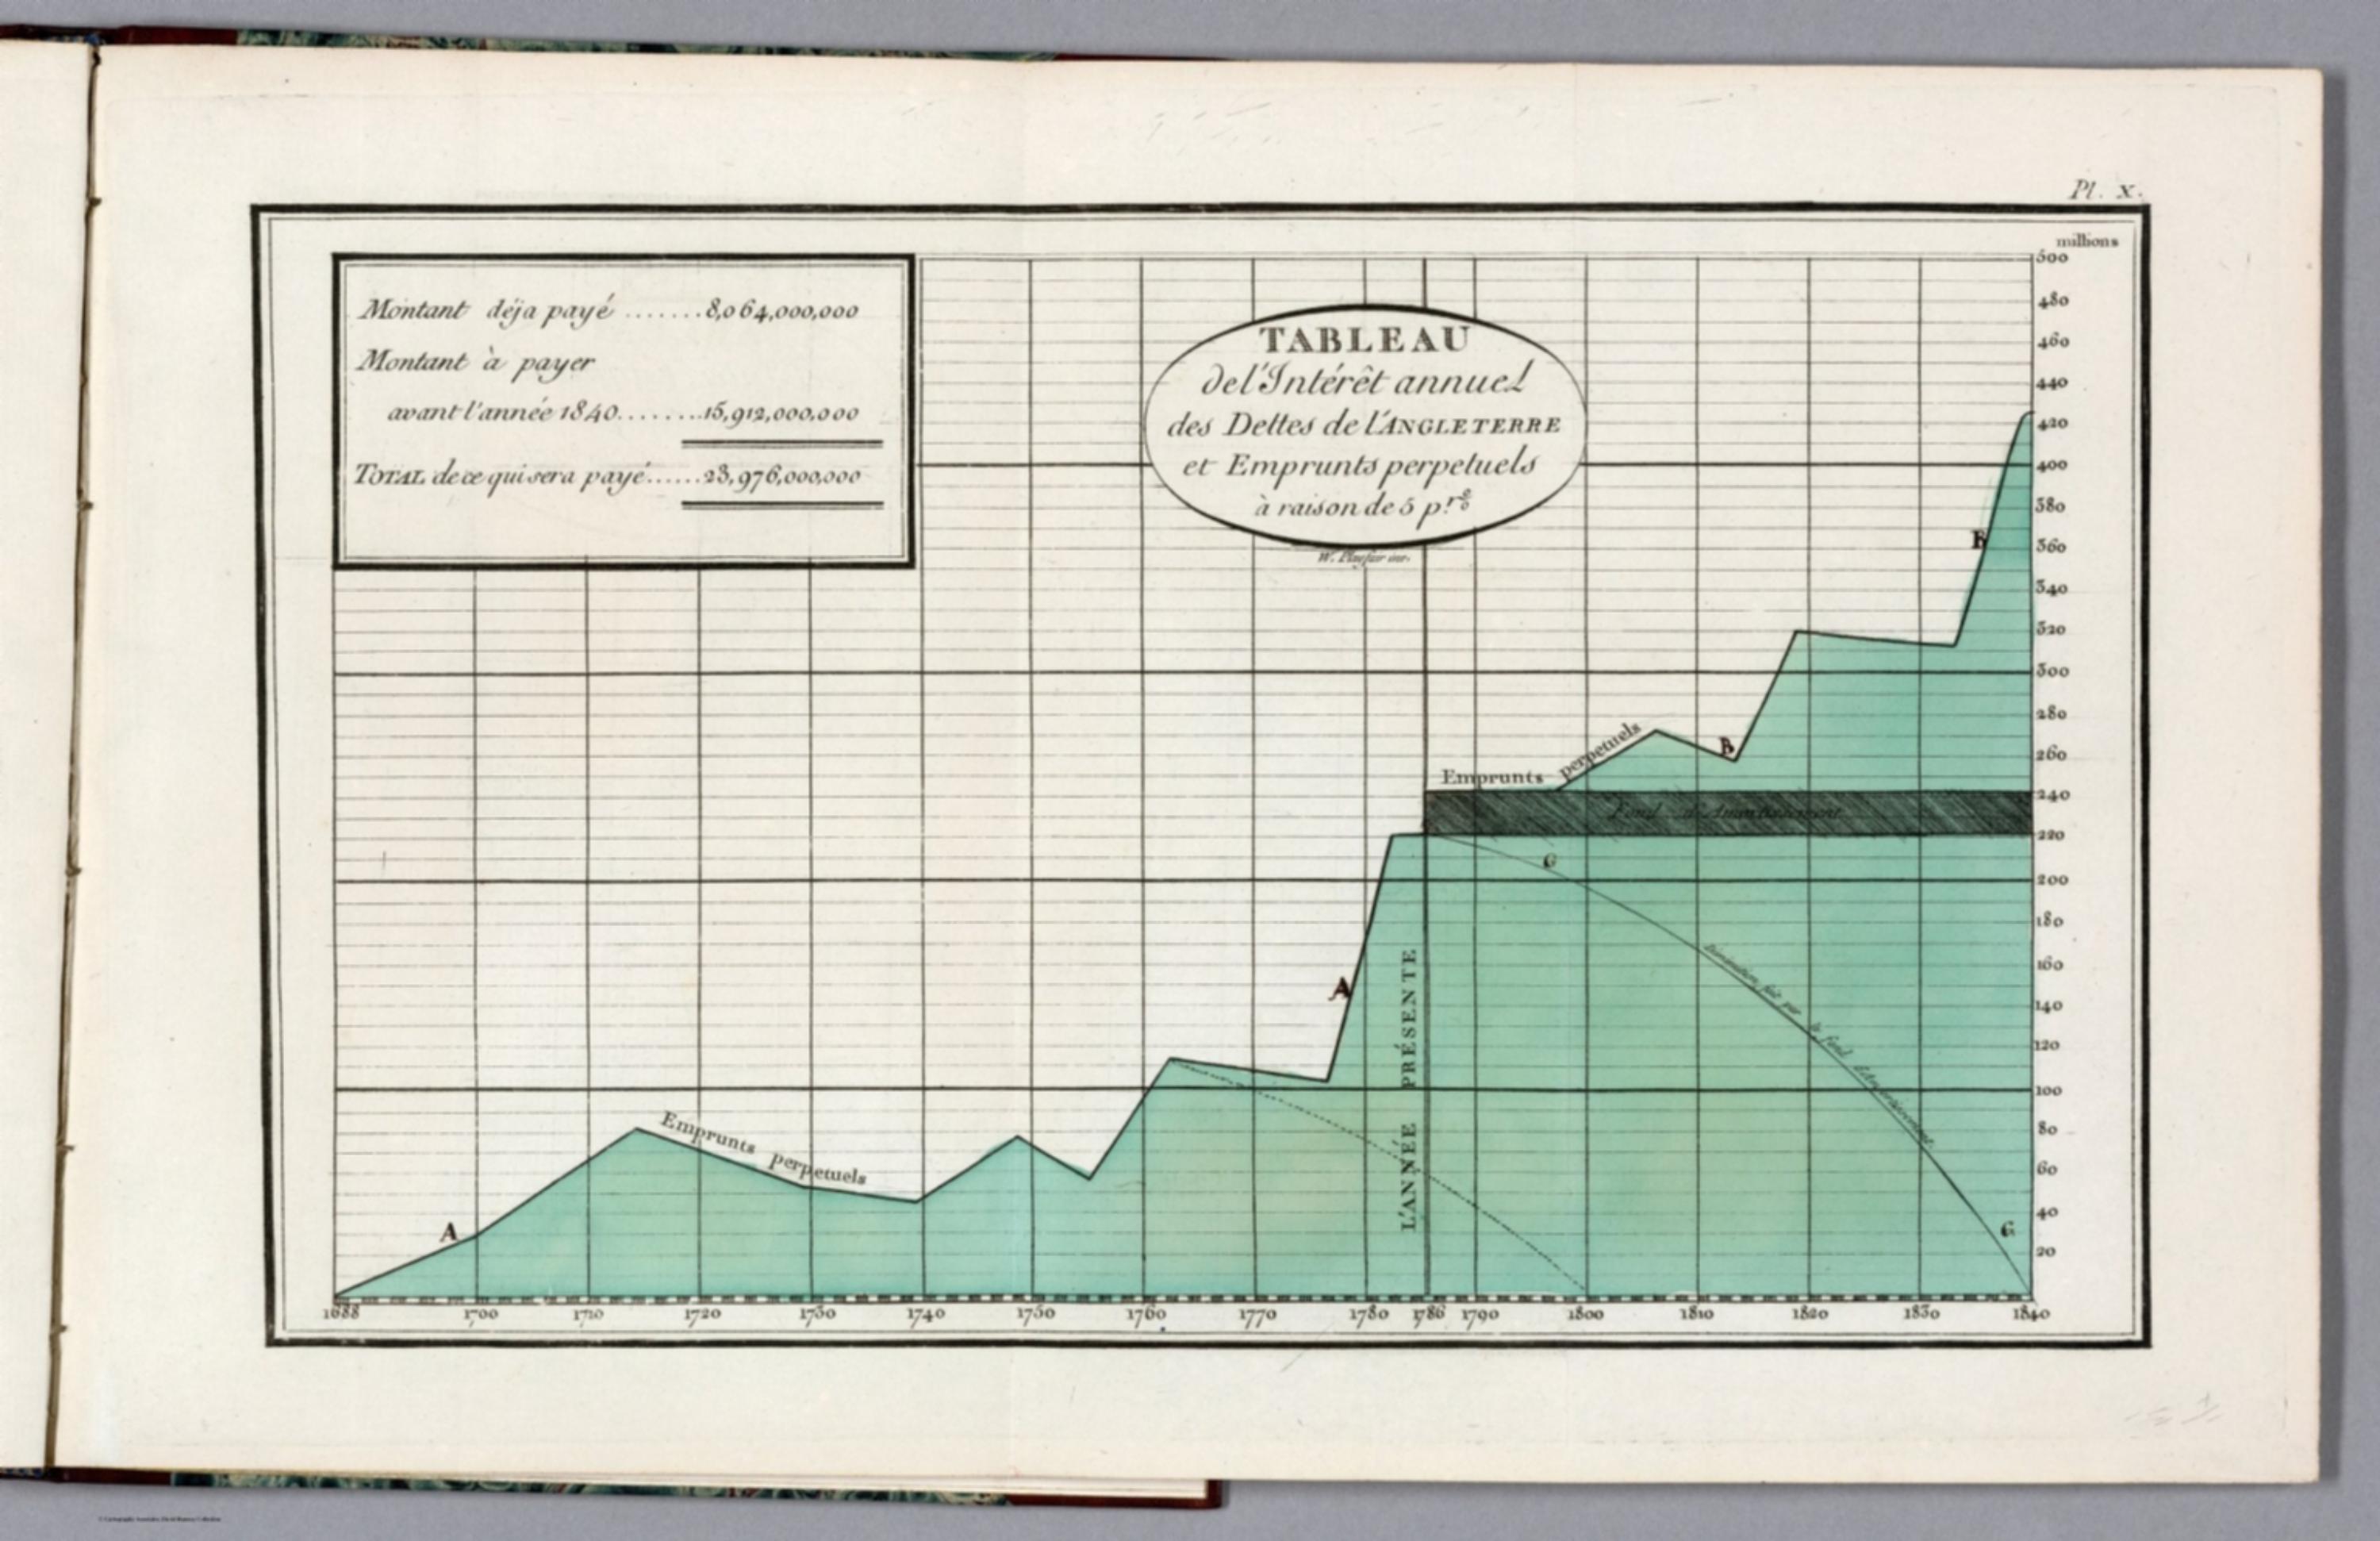
Tableaux d'arithmetique lineaire (French edition of the Commercial and Political Atlas) - Tableau del'intérêt annues des dettes de l'Angleterre et Emprunts perpetuels à raison de 5 pr. % W. Playfair inv [14319.063]
The pattern
This still is filed under Data as proof.
Define
A chart, map, or count that is the argument, not an illustration next to the argument.
Mechanism
Sighted evidence. The reader is asked to believe their eyes: a bar, a share, a spread on a map.
Verdict
The claim is comparative or quantitative and the figure can be read without a caption doing the sell.
Why it works
It is built as the as-is against the could-have-been, sharing axes, scale and visual grammar with the annuity plate so only the silhouette differs: that one has holes in it, this one has none. The cross-hatched band across the top turns an accounting abstraction, the portion of debt that can never be retired, into a visible ceiling sitting on the mass. Running the dashed sinking-fund curve through the same plot makes the gap between the two lines the real subject, so the cost of doing nothing is an area rather than an argument. The vertical present-year rule is doing the ethical work, marking exactly where evidence stops and extrapolation begins.
Steal this when
Use it when you need to show that a recurring cost has no natural end, and you want the shape of the chart rather than a sentence to carry that. Pair it with a second chart of the alternative, drawn to identical scale.