
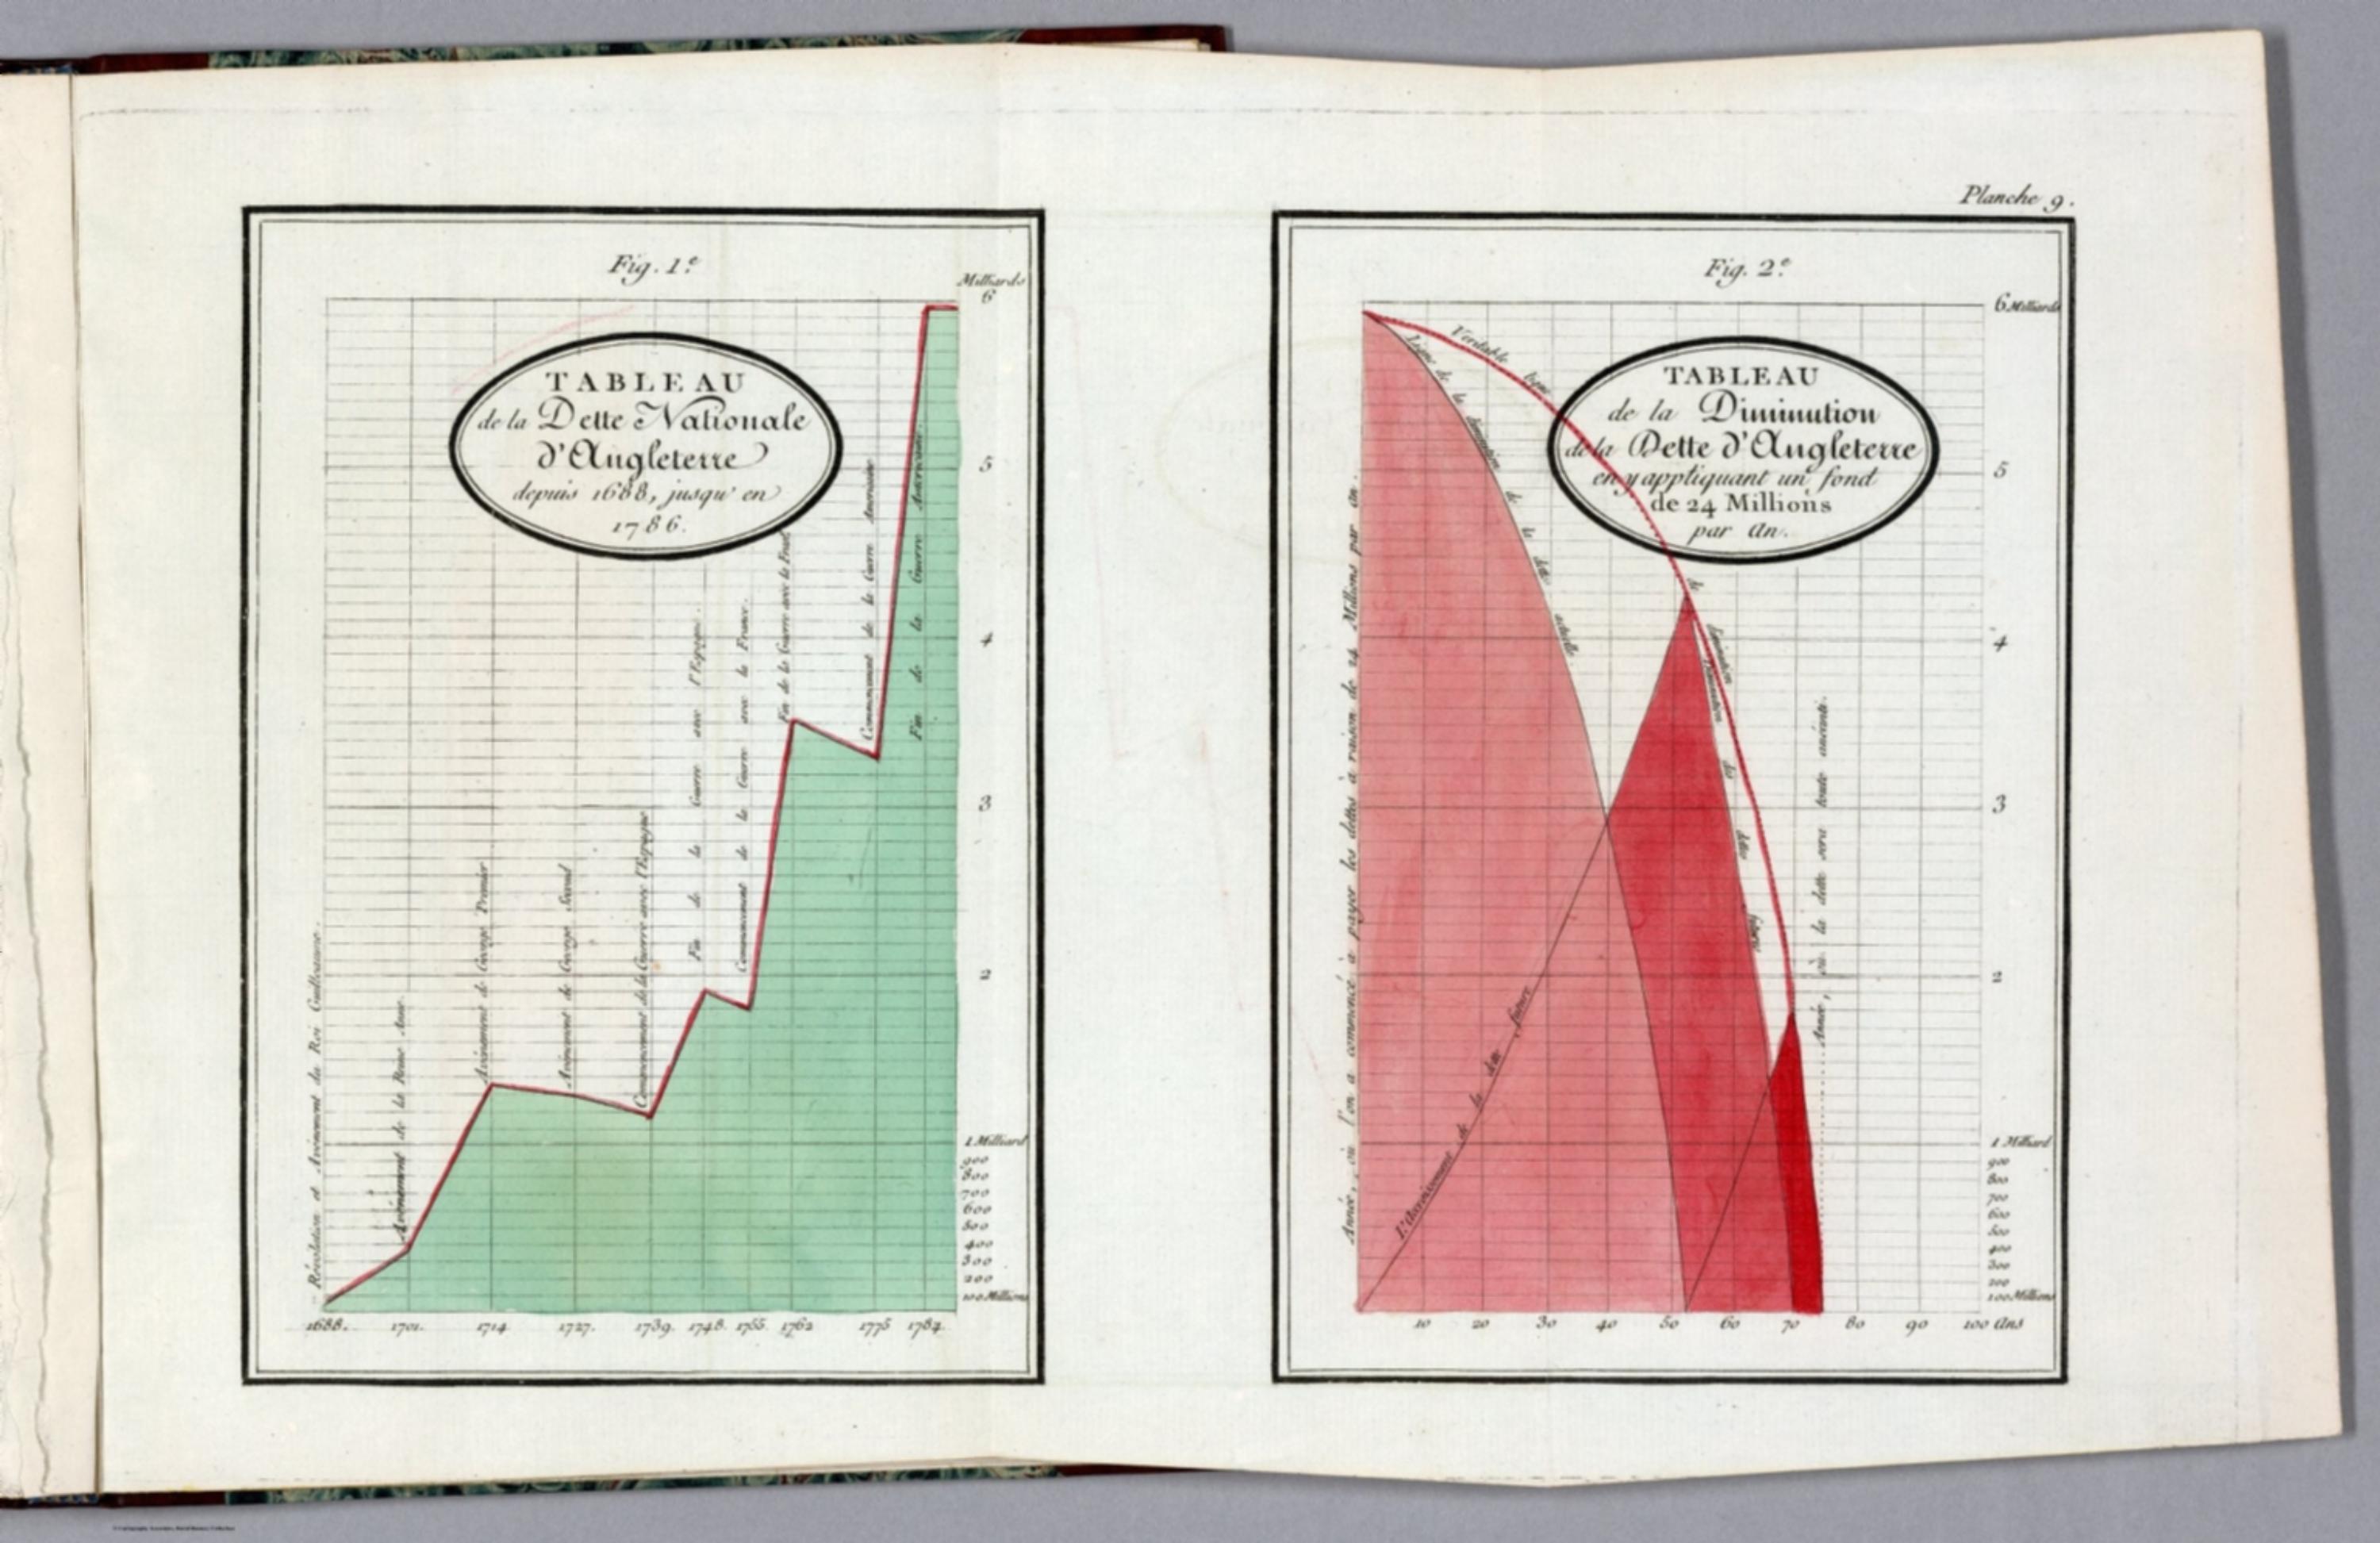
Tableaux d'arithmetique lineaire (French edition of the Commercial and Political Atlas) - Tableau de la dette nationale d'Angleterre depuis 1688, jusqu'en 1786-Tableau de la diminution de la dette d'Angleterre en y apptiquant un fond de 24 millions par an [14319.062]
The pattern
This still is filed under Data as proof.
Define
A chart, map, or count that is the argument, not an illustration next to the argument.
Mechanism
Sighted evidence. The reader is asked to believe their eyes: a bar, a share, a spread on a map.
Verdict
The claim is comparative or quantitative and the figure can be read without a caption doing the sell.
Why it works
The spread is a problem-solution argument built out of direction alone: the left figure goes up, the right figure comes down, and the reader has the verdict before reading a single number. Playfair engraves the causes inside the plot at the point of the data, so the staircase reads as a narrative of wars rather than a column of sums. Filling the area under the line converts a trend into a mass, which makes an accumulated total feel like a physical quantity rather than a rate. Colour carries the register: the debt is drawn in calm green and the remedy in urgent crimson, so the two plates are distinguishable at arm's length.
Steal this when
Use it when you must show a liability that has been compounding for years and you want your remedy sitting on the facing page. The two-figure spread works because the eye compares the two slopes before it reads either caption.
If this library is useful, leave an email
We send new patterns, ads, and notes when we add them. Name and phone are optional.
You are on the list
We will write when we add more library material.