
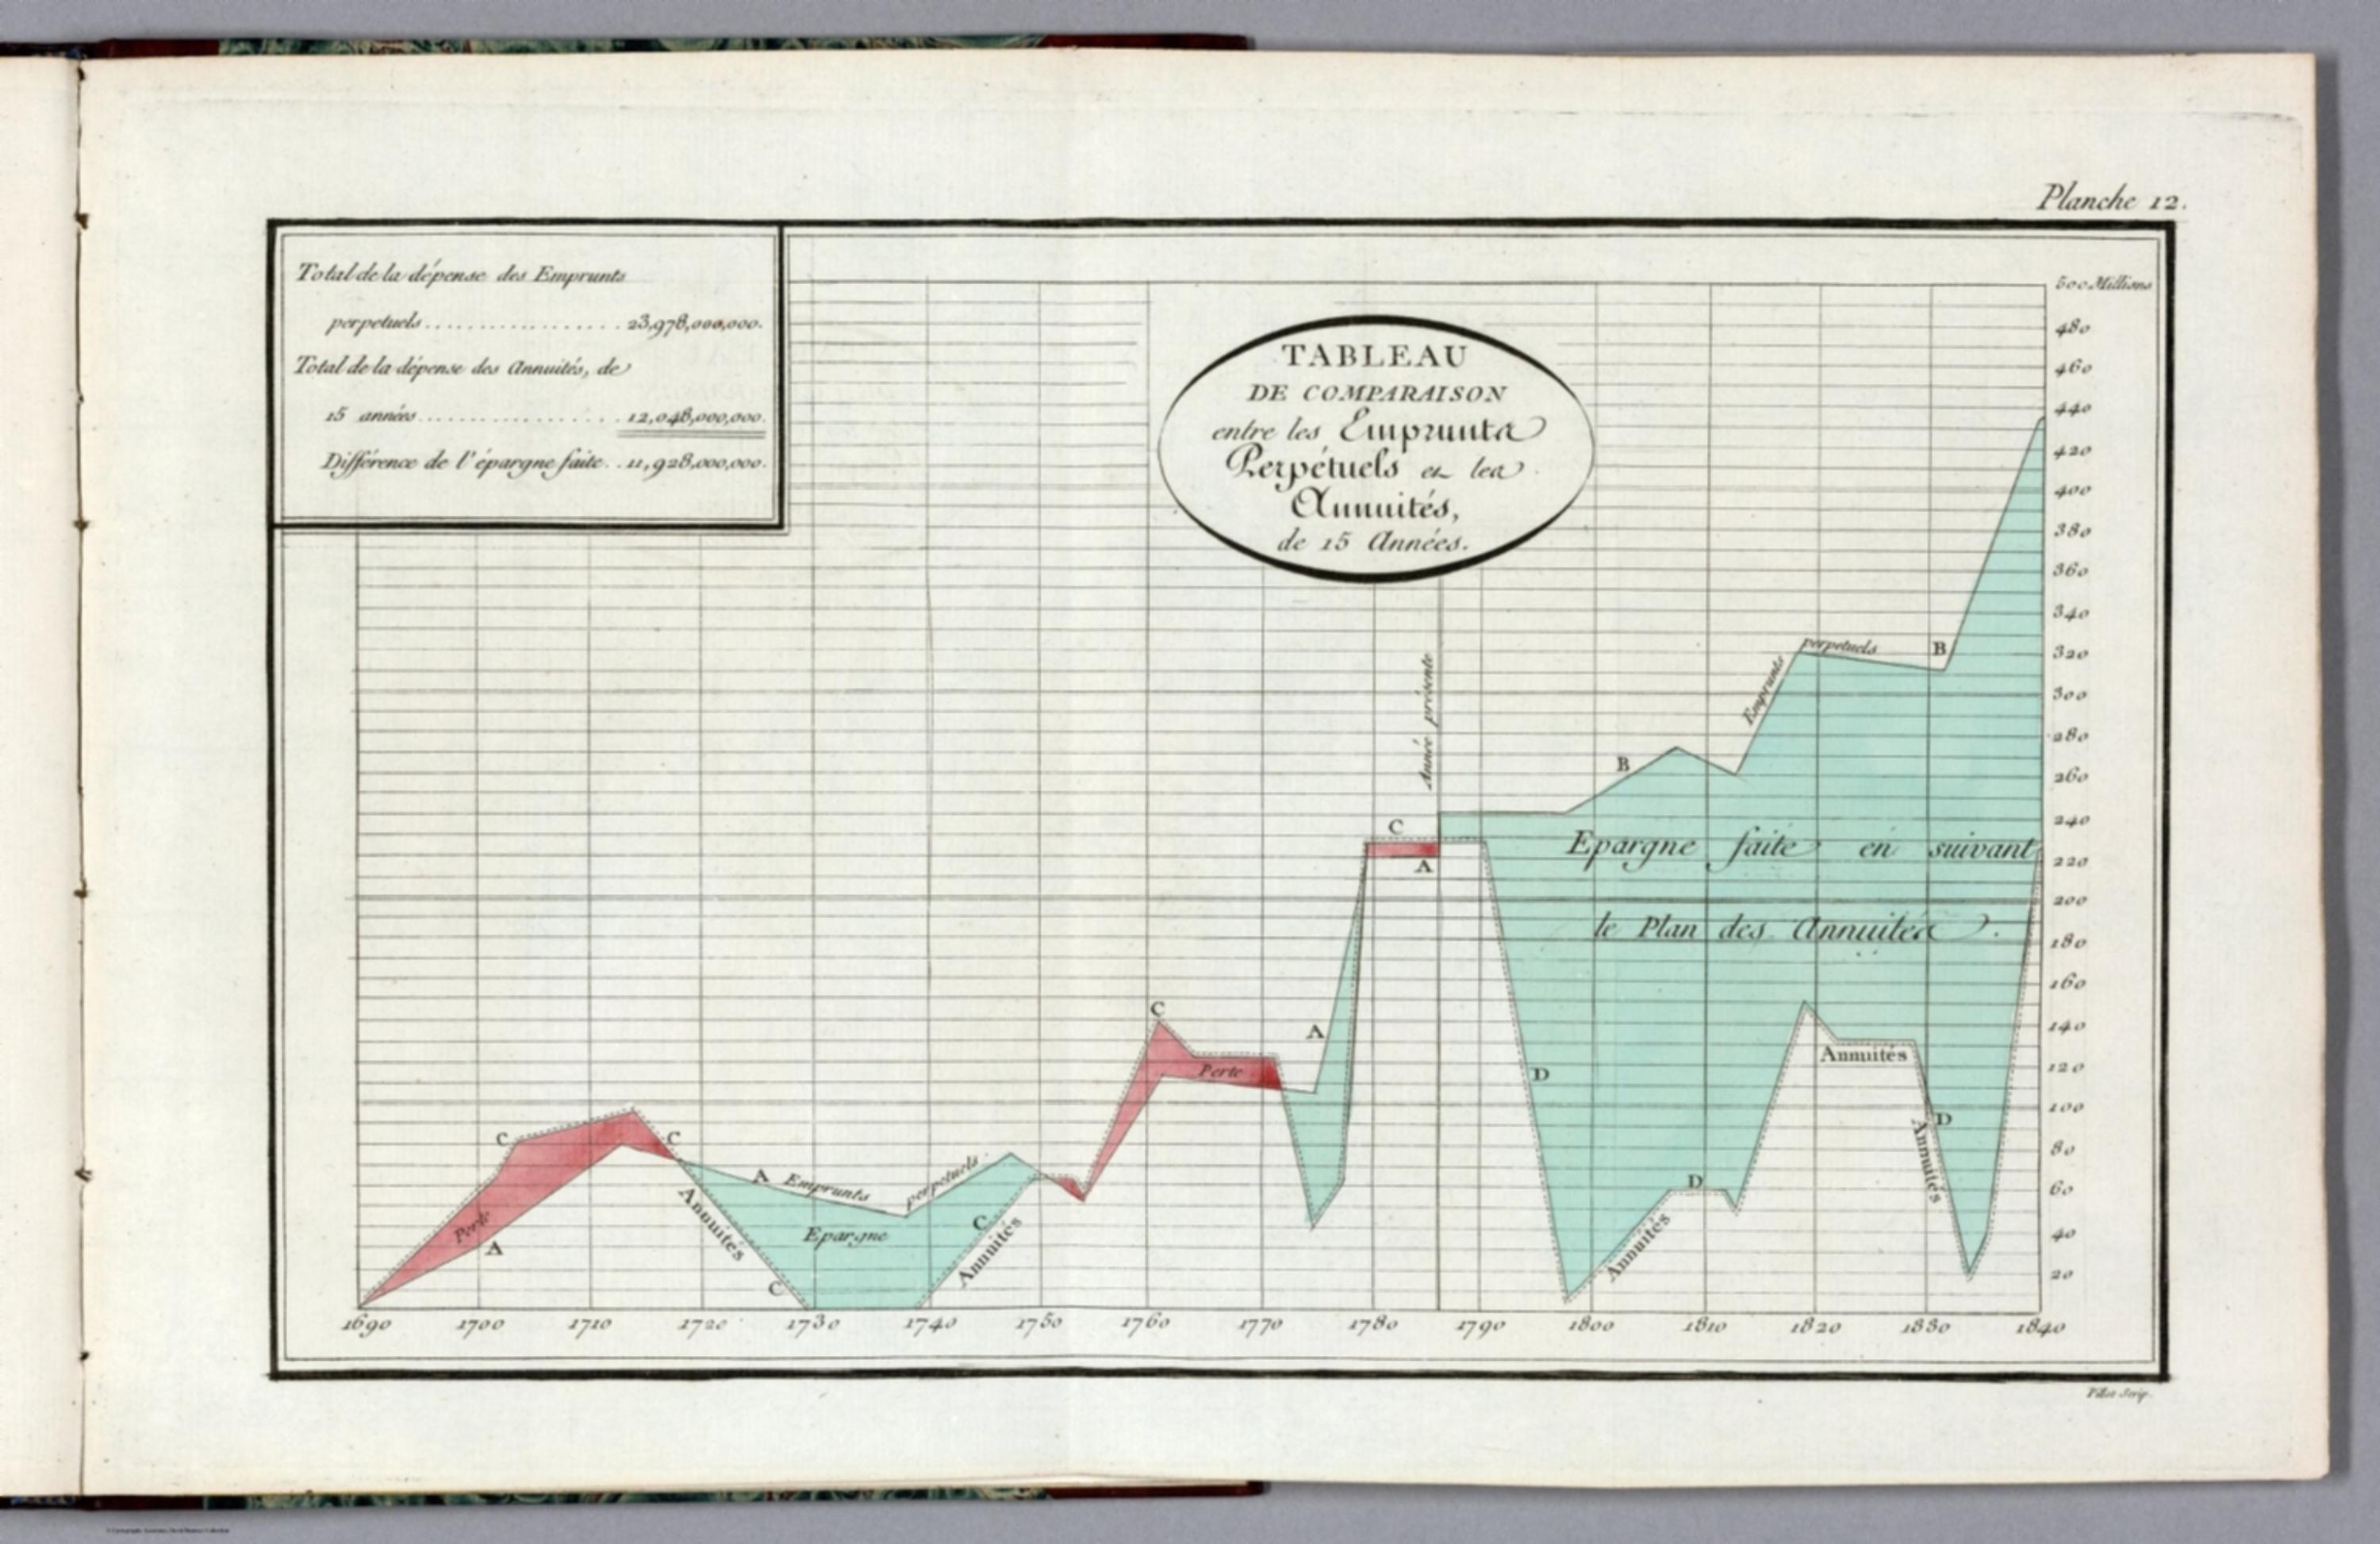
Tableaux d'arithmetique lineaire (French edition of the Commercial and Political Atlas) - Tableau de comparaison entre les emprunta perpetuels et les annuités de 15 années. Pillot Scrip [14319.065]
The pattern
This still is filed under Data as proof.
Define
A chart, map, or count that is the argument, not an illustration next to the argument.
Mechanism
Sighted evidence. The reader is asked to believe their eyes: a bar, a share, a spread on a map.
Verdict
The claim is comparative or quantitative and the figure can be read without a caption doing the sell.
Why it works
The argument is carried by filled area rather than by the two lines, so the reader is shown a quantity of money rather than asked to subtract one curve from another. The two-colour fill is a moral code, not decoration - red for loss, green for saving - and it flips at every crossing, so the history reads as a sequence of wins and losses before any figure is consulted. The vertical present-year rule splits evidence from projection, which licenses the forecast instead of hiding it. And the boxed totals sit inside the plot area, so the exact number and the picture of it are never more than an eye movement apart.
Steal this when
Use this when the case rests on the cumulative gap between two options over time - draw both, fill the difference, and colour the fill by which side is winning. The boxed total inside the chart is the move to copy whenever a sceptic will want the arithmetic before they accept the shape.