
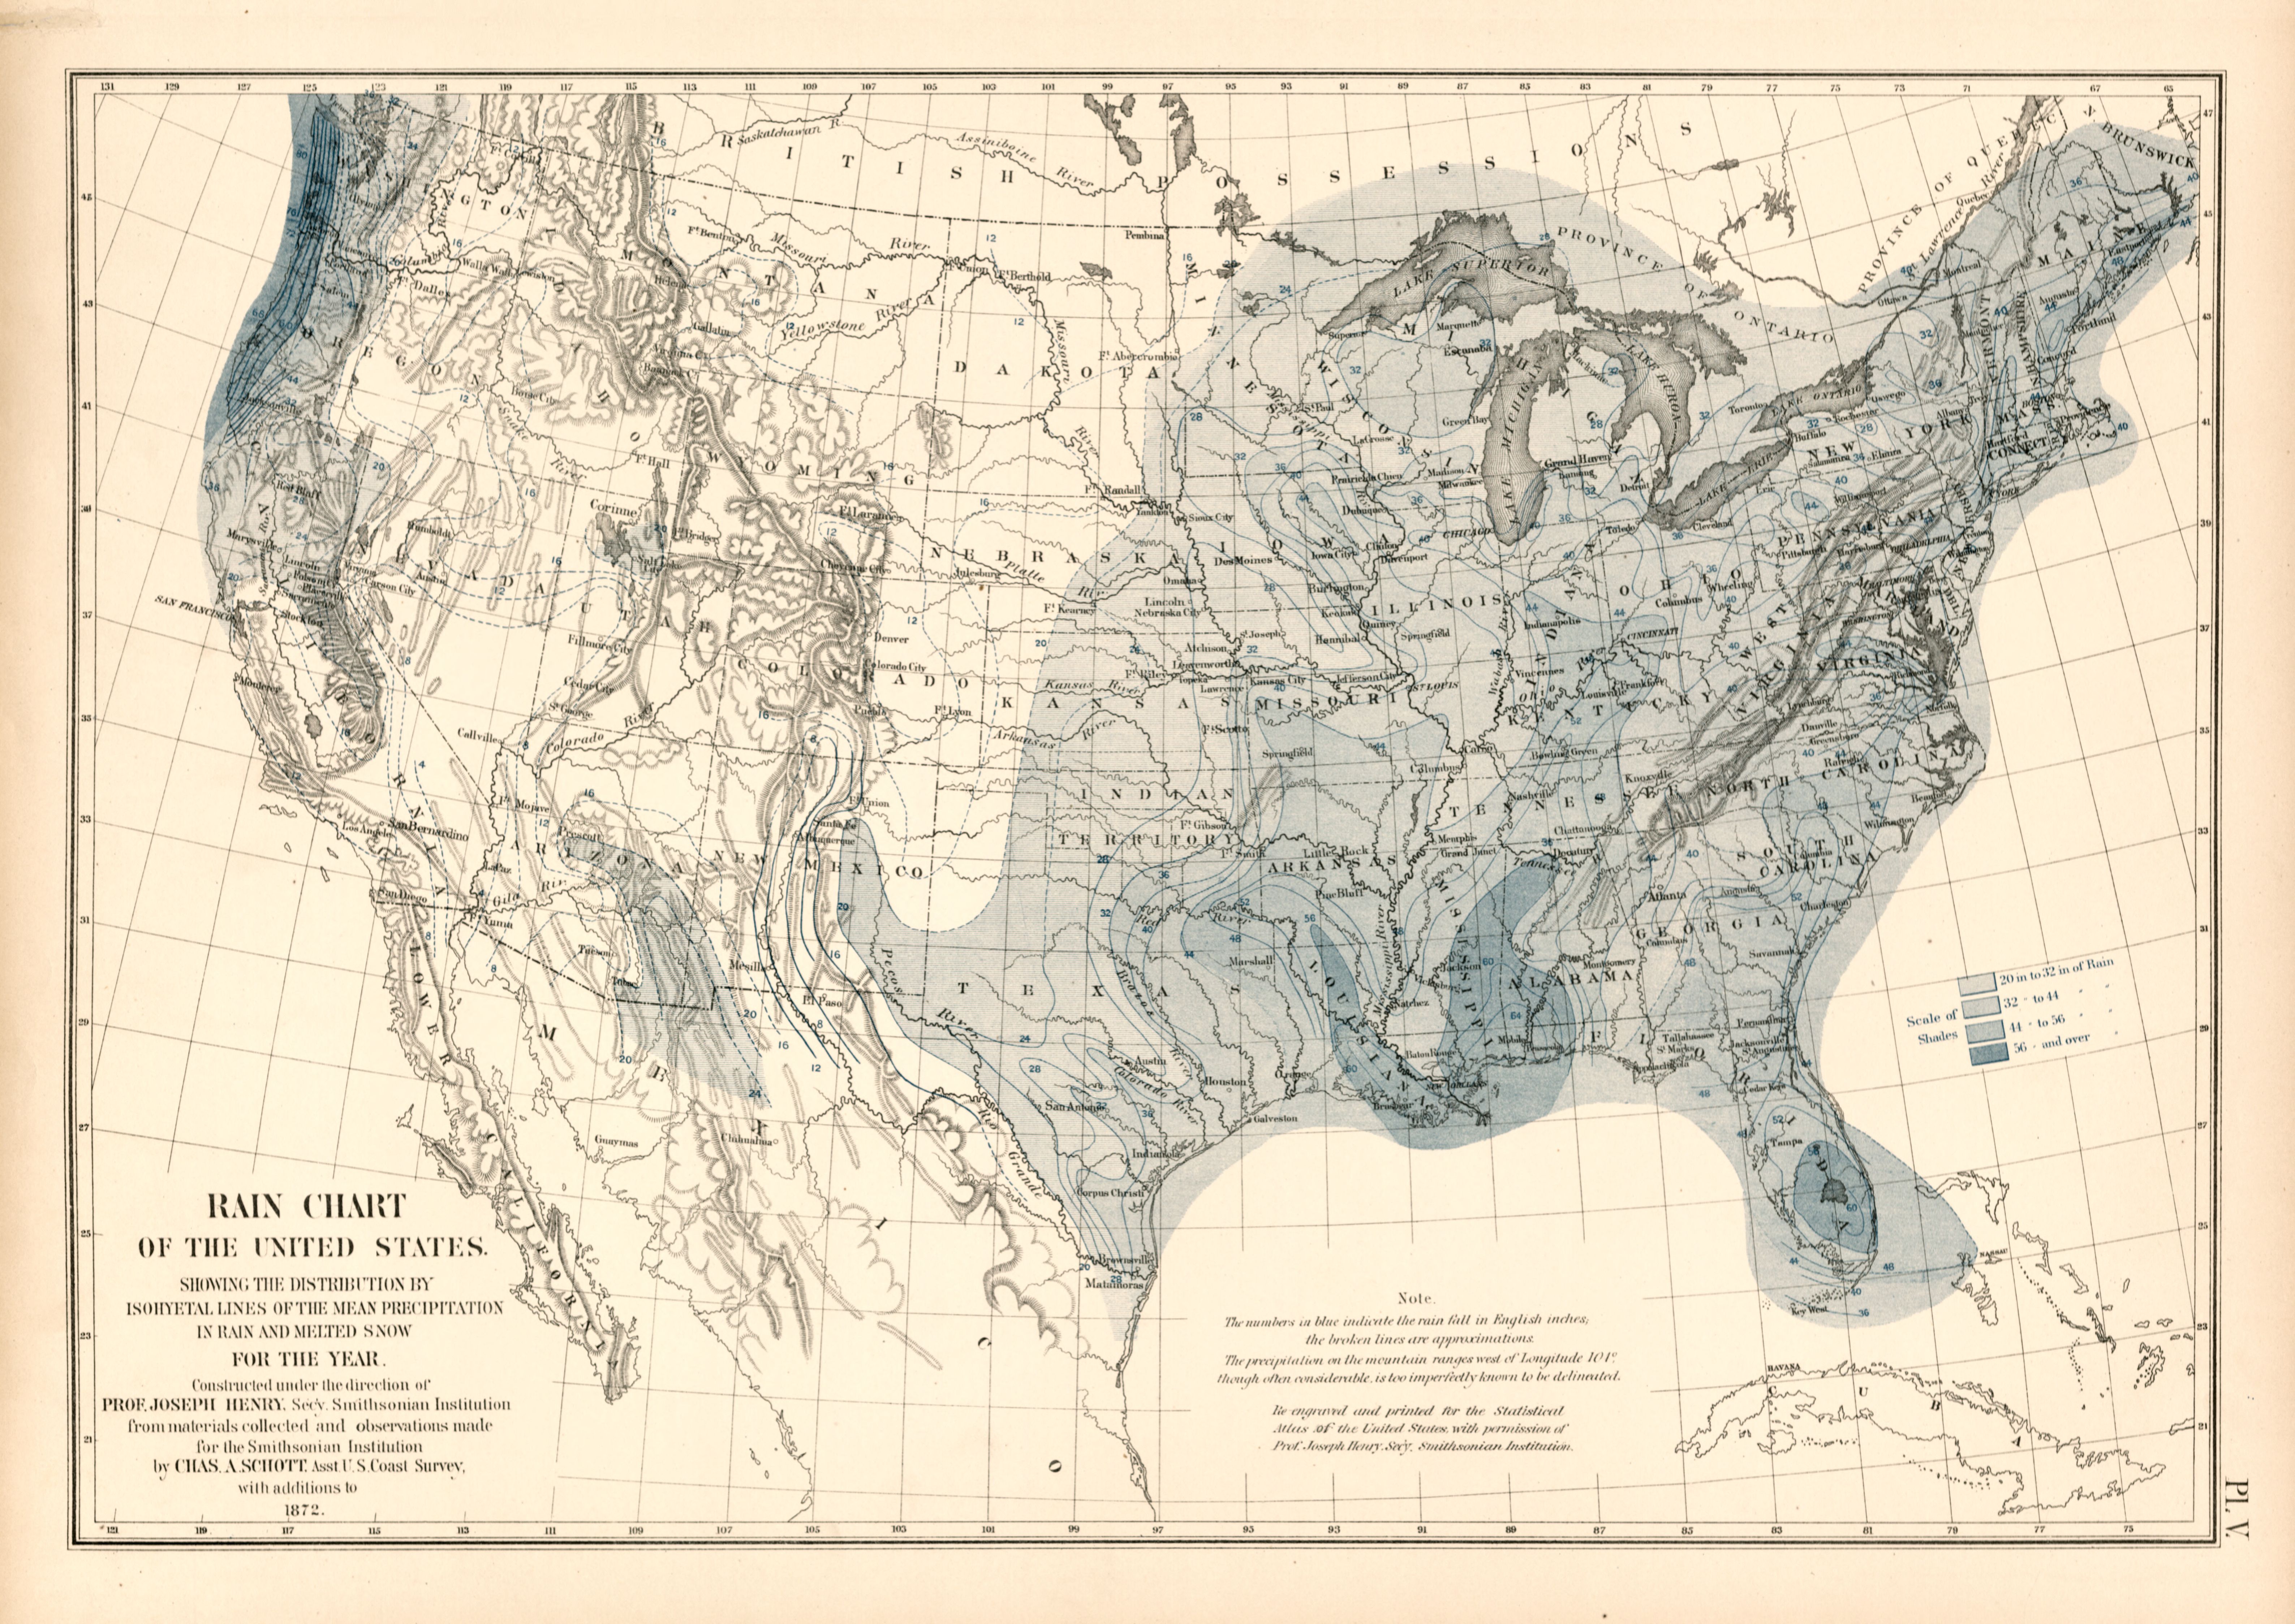
Statistical Atlas of the United States Based on the Results of the Ninth Census (1870) - plate 30: Rain Chart of the United States
The pattern
This still is filed under Data as proof.
Define
A chart, map, or count that is the argument, not an illustration next to the argument.
Mechanism
Sighted evidence. The reader is asked to believe their eyes: a bar, a share, a spread on a map.
Verdict
The claim is comparative or quantitative and the figure can be read without a caption doing the sell.
Why it works
Layering flat bands under fine contour lines serves two readers at once: the banded wash gives regional shape at a glance and the labelled isohyets give an engineer an exact number without a second chart. The blue is the only colour on the sheet, so the boundary of the wash reads as a hard fact rather than a gradient of opinion. The credit block is stacked as typography, not buried in a footnote, because on a contested subject the authority chain is part of the evidence. Publishing the Note that mountain precipitation is too imperfectly known to be delineated buys credibility for everything that is drawn.
Steal this when
Use this when one variable has a natural threshold that splits your territory or market in two, and both the shape and the exact values matter. Band the ranges in a single colour for the shape, run labelled contours through them for the precision, and state in a visible note exactly where your data is too thin to draw.