
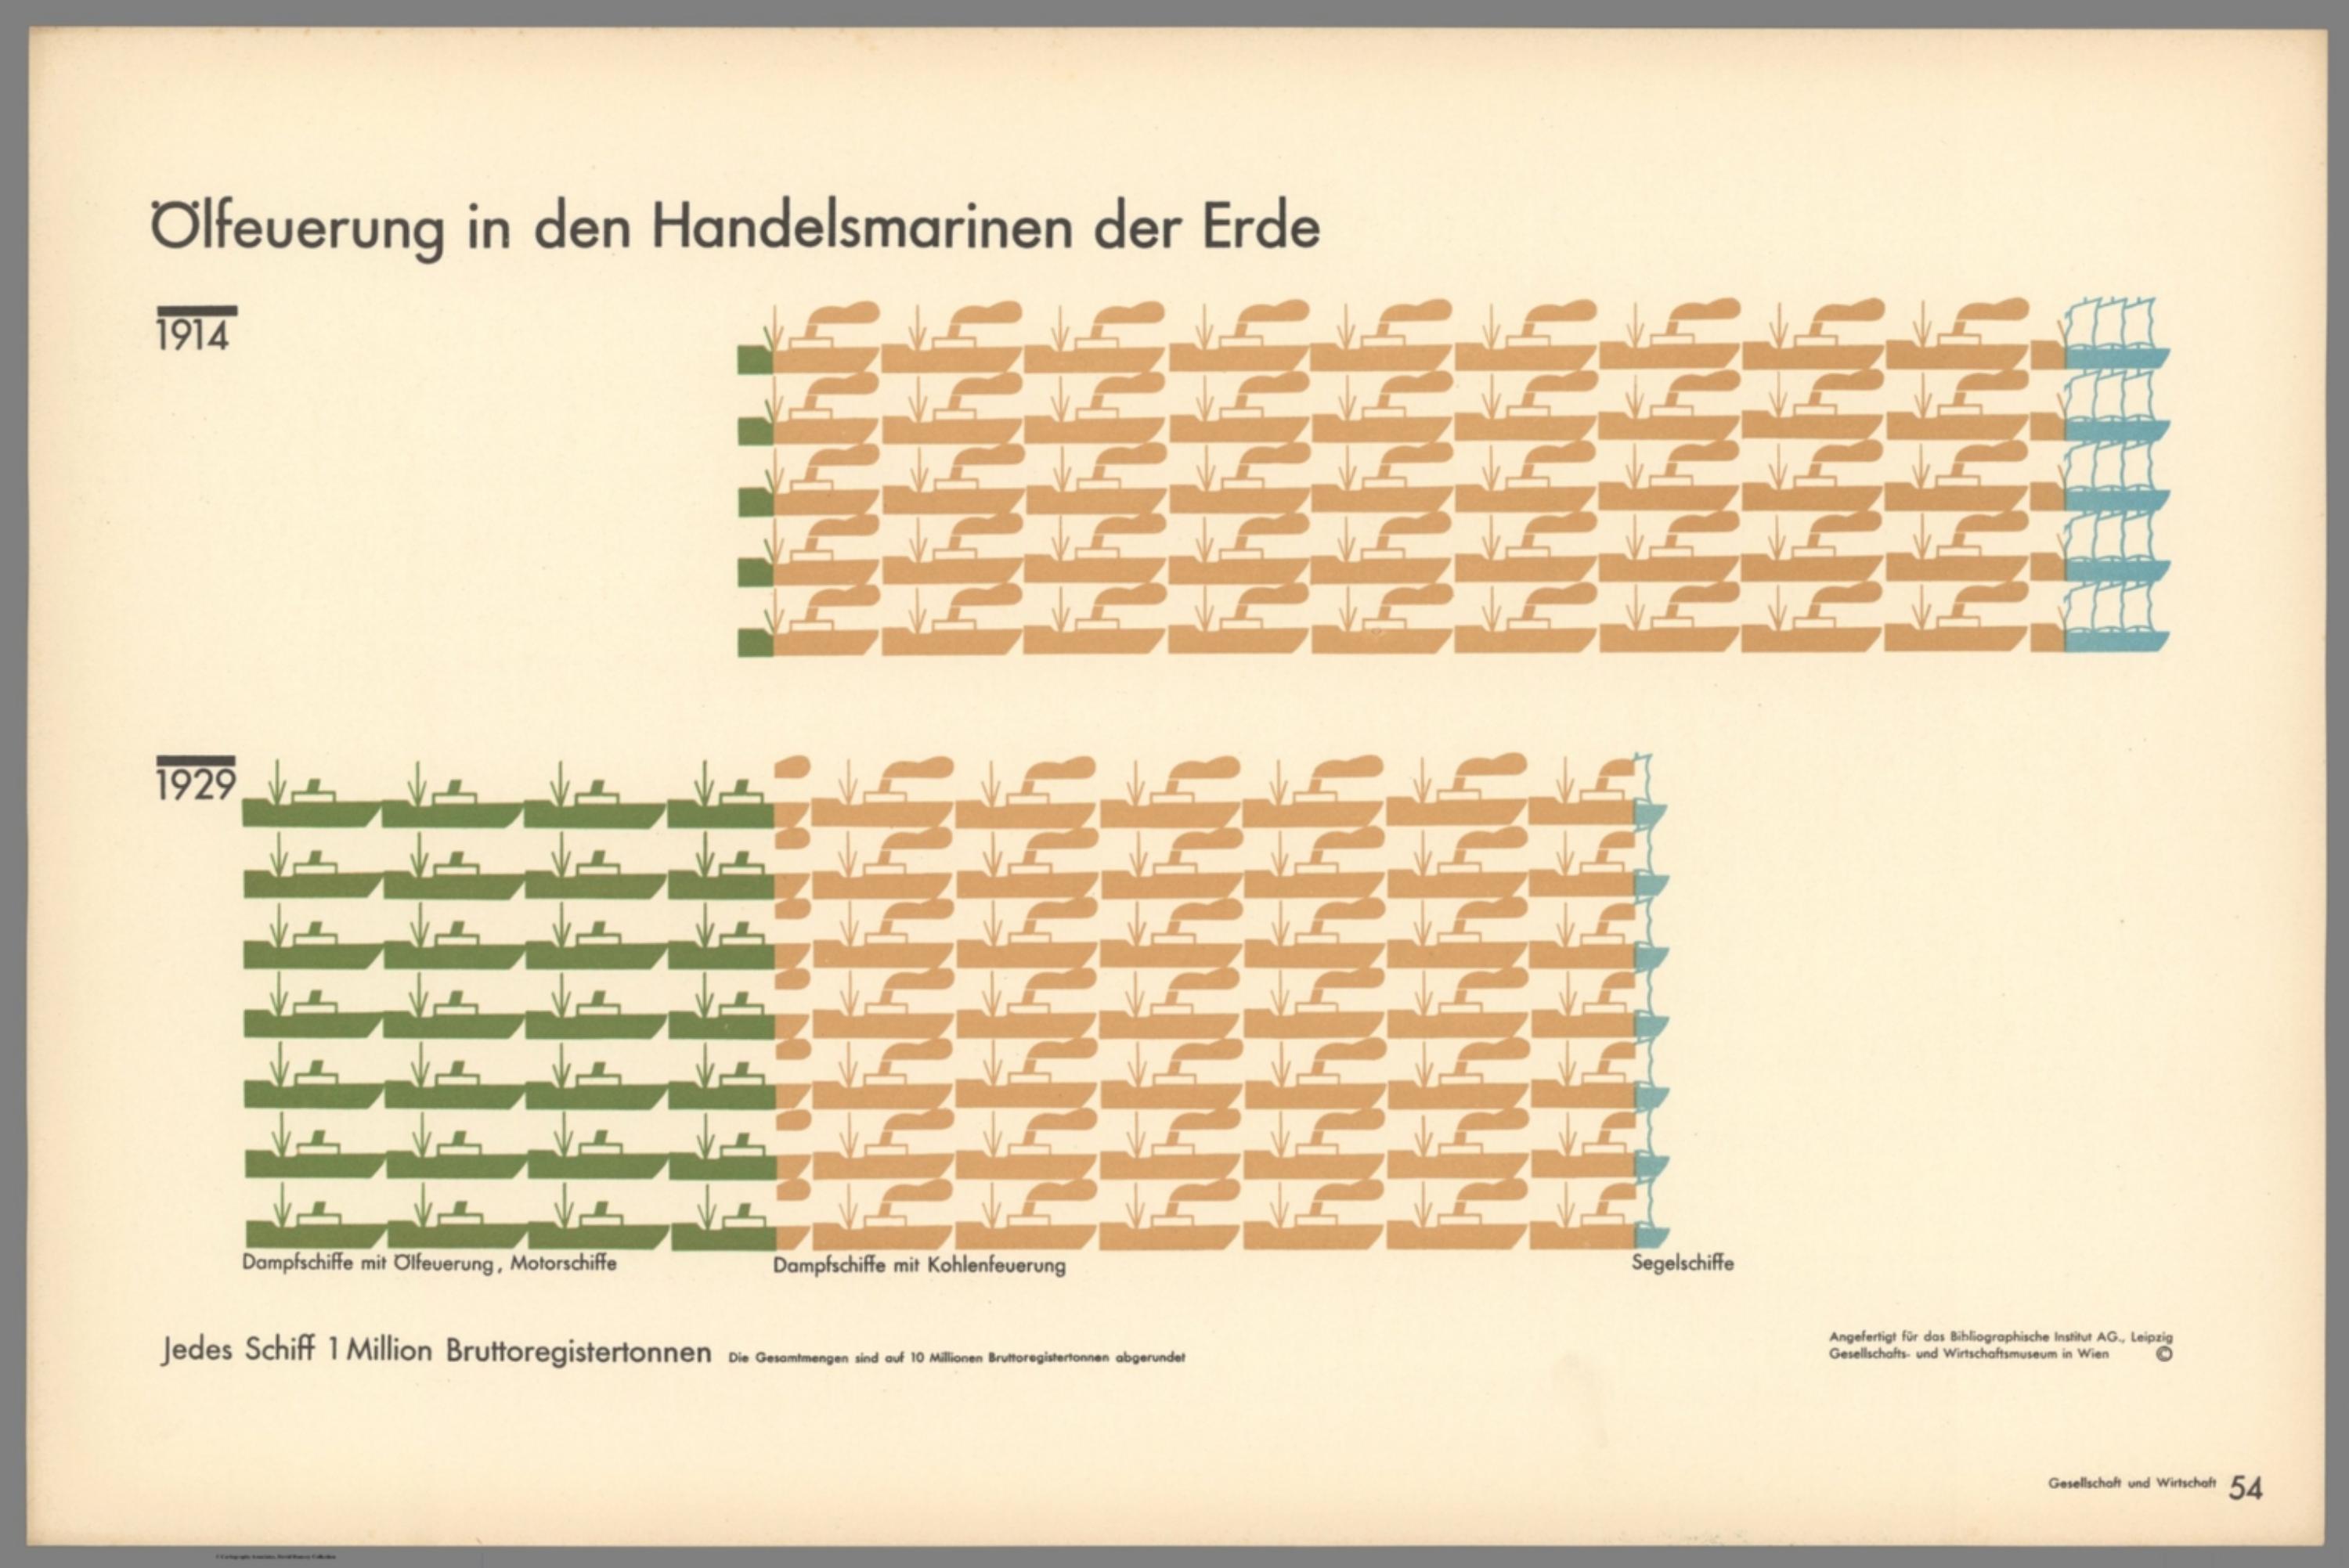
Gesellschaft und Wirtschaft: Bildstatistisches Elementarwerk - Ölfeuerung in den Handelsmarinen der Erde : 1914-1929 [14080.057]
The pattern
This still is filed under Data as proof.
Define
A chart, map, or count that is the argument, not an illustration next to the argument.
Mechanism
Sighted evidence. The reader is asked to believe their eyes: a bar, a share, a spread on a map.
Verdict
The claim is comparative or quantitative and the figure can be read without a caption doing the sell.
Why it works
Both years are left-aligned on the same grid of identical ships, so the reader is not asked to compare percentages - the rows physically lengthen and the green segment physically lengthens faster. Ordering the three fuel types in the same left-to-right sequence in both blocks turns the change into a boundary that visibly slides right. The pictograms are differentiated by a single feature each - smoke plume, mast, rigging - which is the minimum needed to tell them apart at this size and the maximum that survives the repetition. Printing the rounding rule in small type under the unit key buys credibility by admitting the imprecision rather than hiding it.
Steal this when
Steal this when a mix shifts between two dates and you want the reader to feel a boundary moving, not read two pie charts. It is the right form when the total also grows, because a left-aligned unit block shows growth and substitution in the same picture.
If this library is useful, leave an email
We send new patterns, ads, and notes when we add them. Name and phone are optional.
You are on the list
We will write when we add more library material.