
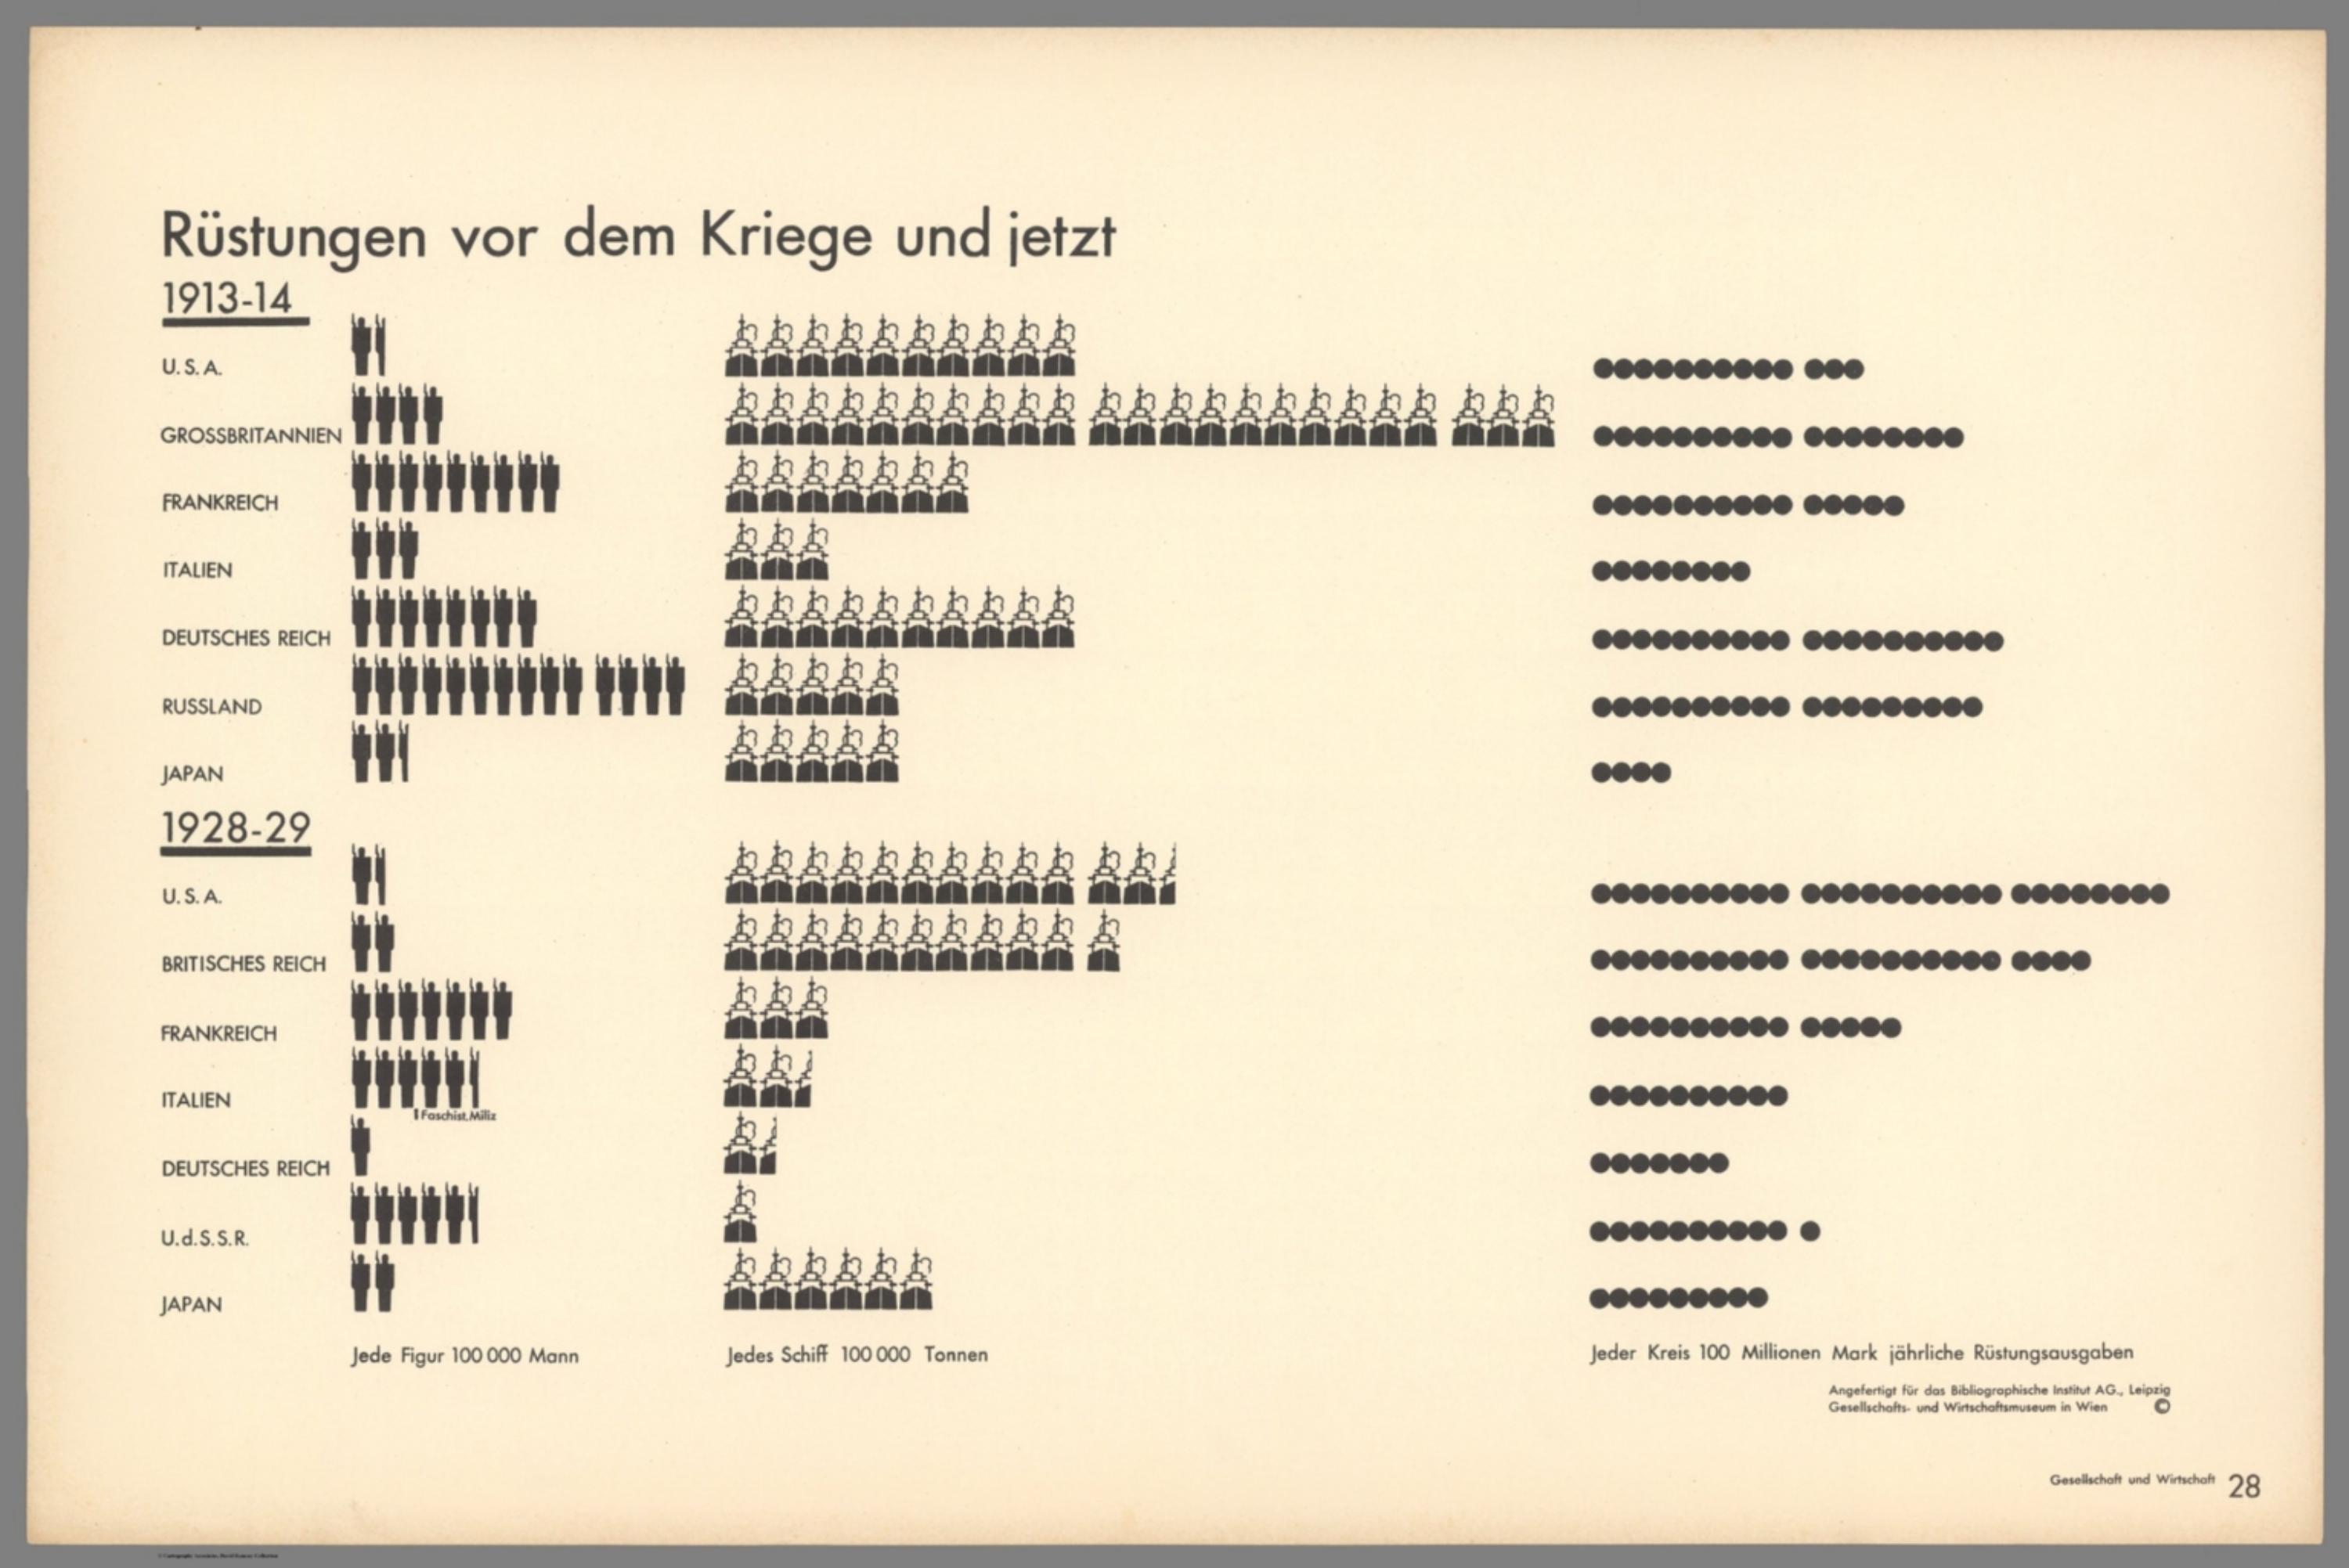
Gesellschaft und Wirtschaft: Bildstatistisches Elementarwerk - Rūstungen vor dem Kriege und jetzt : 1913-1914-1928-29 [14080.031]
The pattern
This still is filed under Data as proof.
Define
A chart, map, or count that is the argument, not an illustration next to the argument.
Mechanism
Sighted evidence. The reader is asked to believe their eyes: a bar, a share, a spread on a map.
Verdict
The claim is comparative or quantitative and the figure can be read without a caption doing the sell.
Why it works
Three unlike quantities are put on one row without ever being added together, which is the discipline most dashboards break: each column keeps its own unit and its own symbol, and the comparison happens because the columns stay in register, not because the numbers were forced into a common scale. Dropping colour entirely is a decision, not a limitation - it makes the plate read as a hard ledger next to the coloured sheets around it, and it stops any bloc being flattered by a warm hue. Repeating the same seven-row frame for both periods means the growth from 1913-14 to 1928-29 is visible as row length alone. The soldier and ship marks are the least heroic possible: no faces, no flags, no motion.
Steal this when
Steal this whenever an entity has to be judged on several measures that cannot be summed - headcount, capital, spend - and a single composite score would be a lie. Give each measure its own column and its own unit, keep the rows in register, and let the profile emerge.
If this library is useful, leave an email
We send new patterns, ads, and notes when we add them. Name and phone are optional.
You are on the list
We will write when we add more library material.