
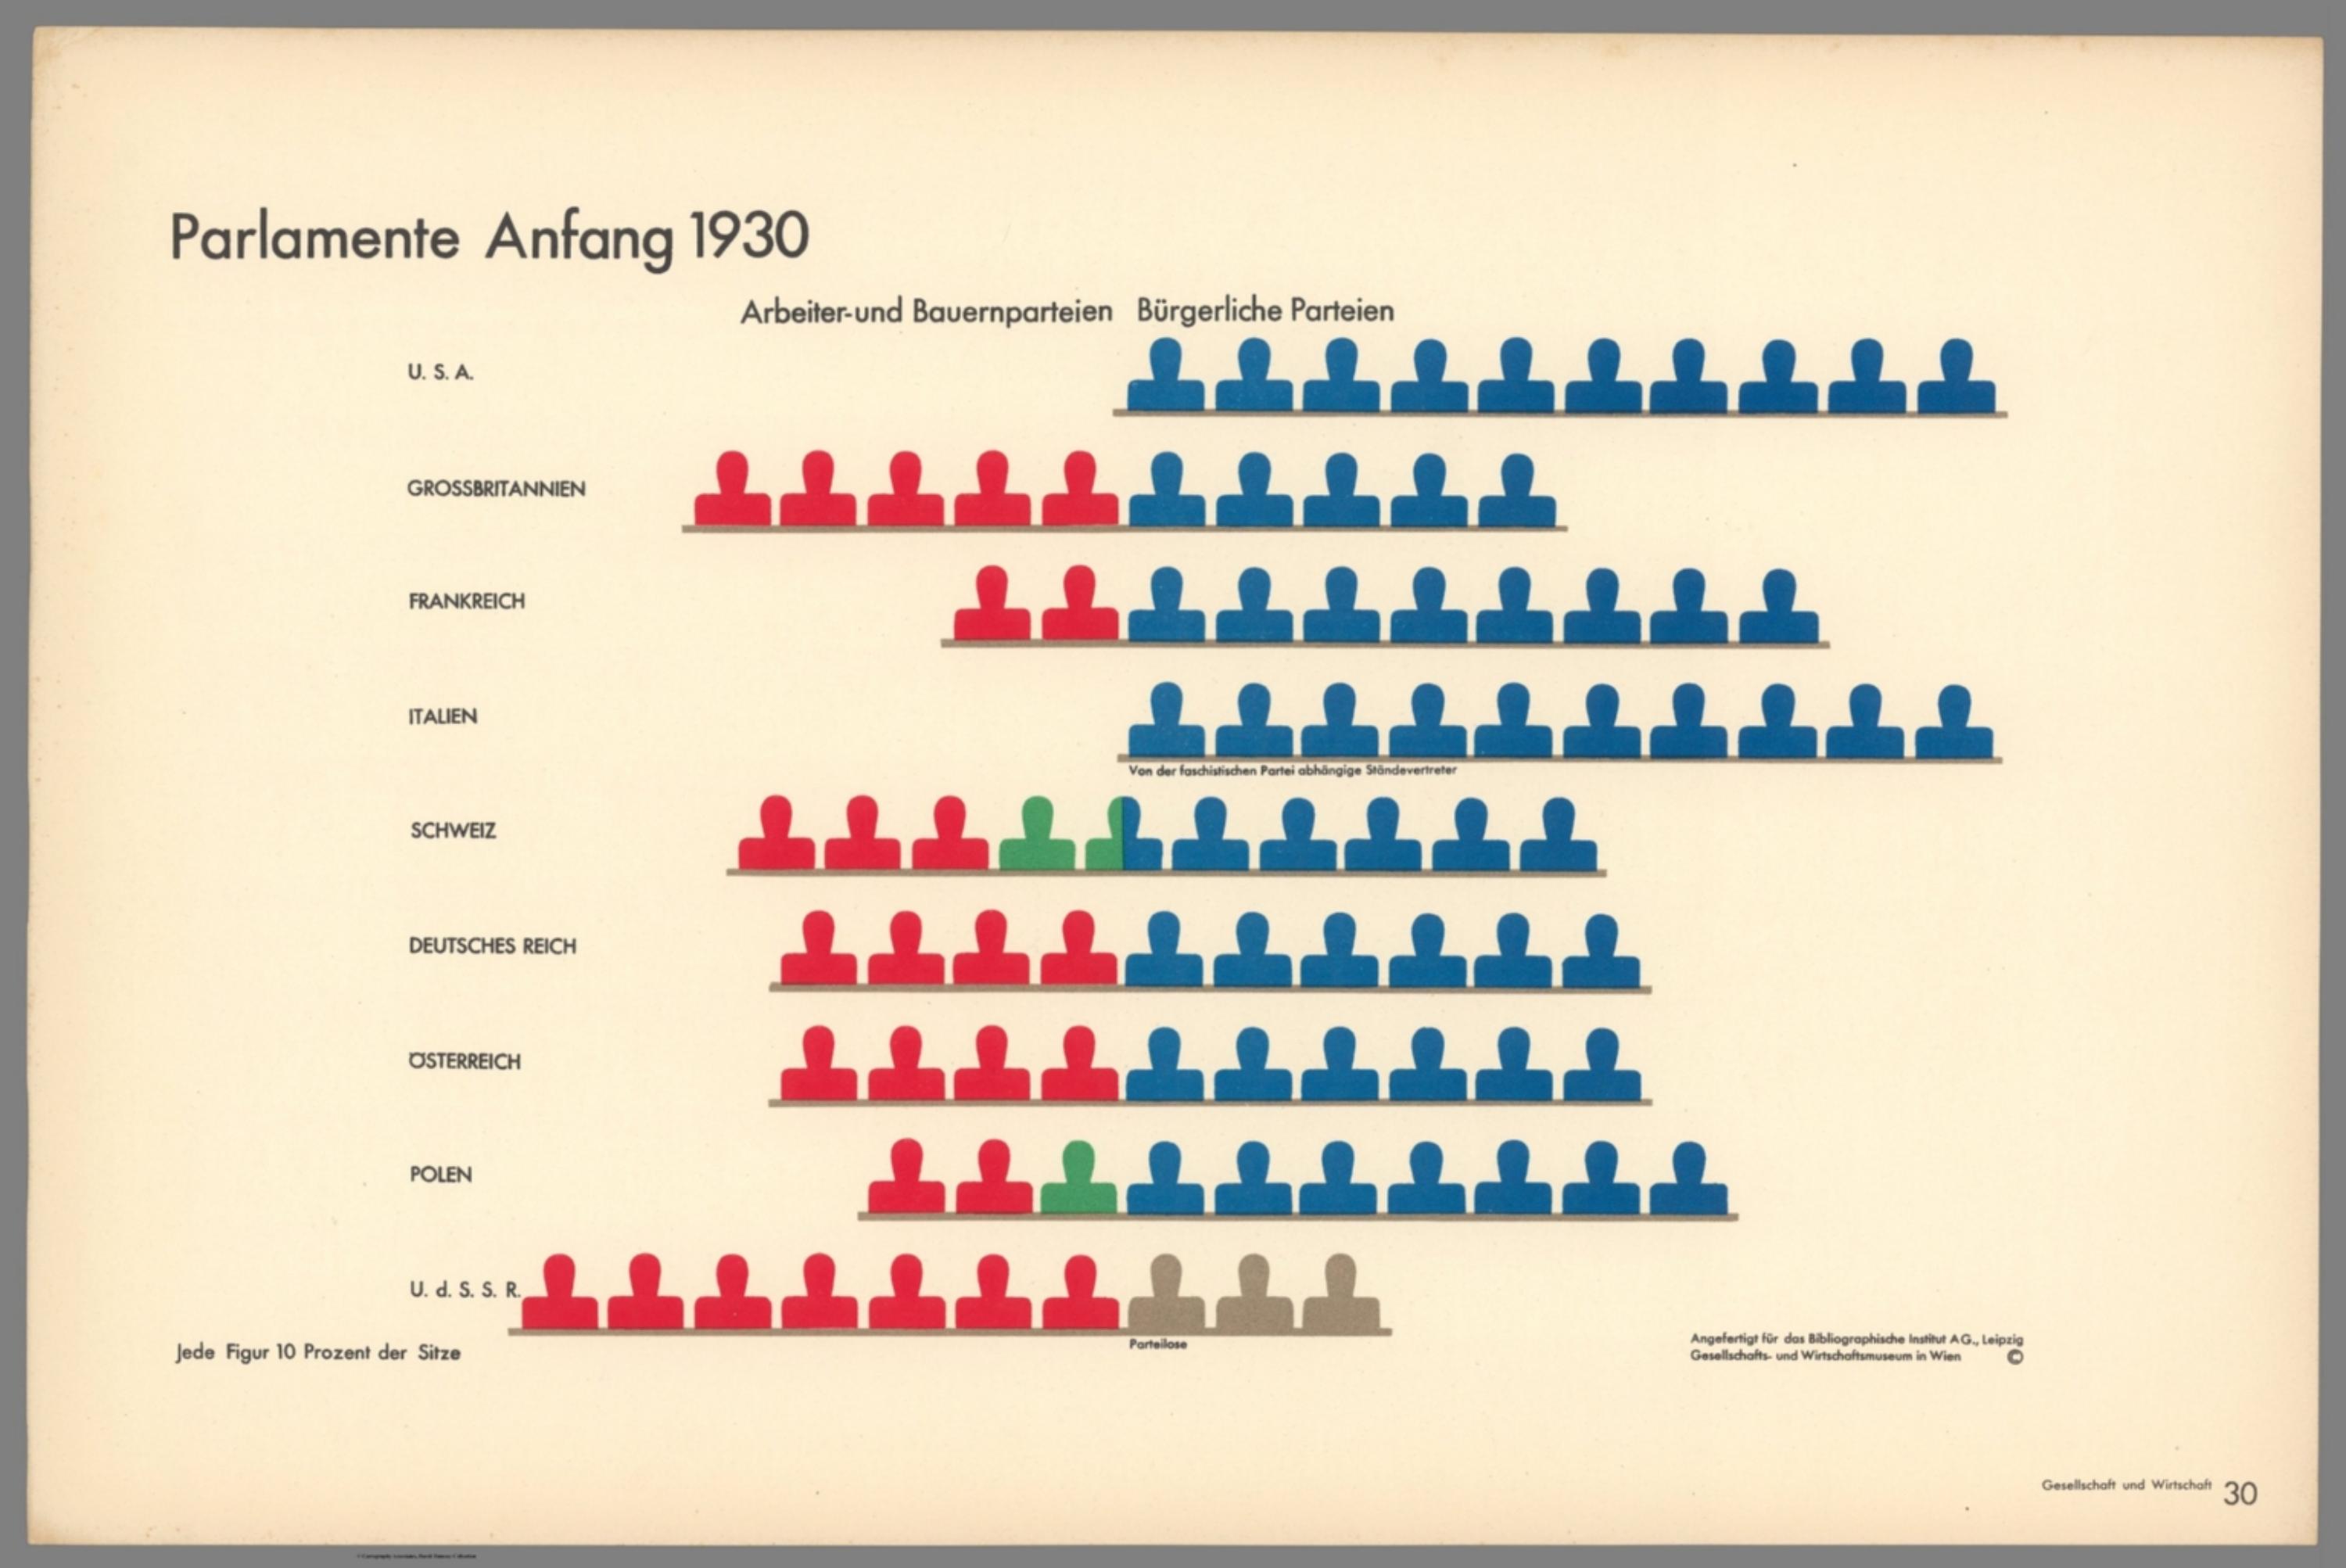
Gesellschaft und Wirtschaft: Bildstatistisches Elementarwerk - Parlamente anfang 1930 [14080.033]
The pattern
This still is filed under Data as proof.
Define
A chart, map, or count that is the argument, not an illustration next to the argument.
Mechanism
Sighted evidence. The reader is asked to believe their eyes: a bar, a share, a spread on a map.
Verdict
The claim is comparative or quantitative and the figure can be read without a caption doing the sell.
Why it works
This is a diverging bar chart built from counted figures rather than lengths, aligned on the split rather than on a margin, so the reader compares the two sides of every parliament against a single vertical and never has to hold a number in mind. Because each figure is a fixed ten per cent of seats, every row is the same length and the comparison is honestly share-to-share. The colour code is not local to this plate - red, blue and green mean the same thing across the whole volume, so a reader who has seen ten plates reads this one without the legend. Footnoting Italy's Ständevertreter and the Soviet Parteilose in six-point type keeps the clean bands intact while refusing to pretend those cases are ordinary.
Steal this when
Reach for this when you are comparing the same two-way split across many entities - for us against them share by market, or budget split by department - and the interesting fact is who leans which way rather than who is biggest. Align on the split, not the left edge.
If this library is useful, leave an email
We send new patterns, ads, and notes when we add them. Name and phone are optional.
You are on the list
We will write when we add more library material.