
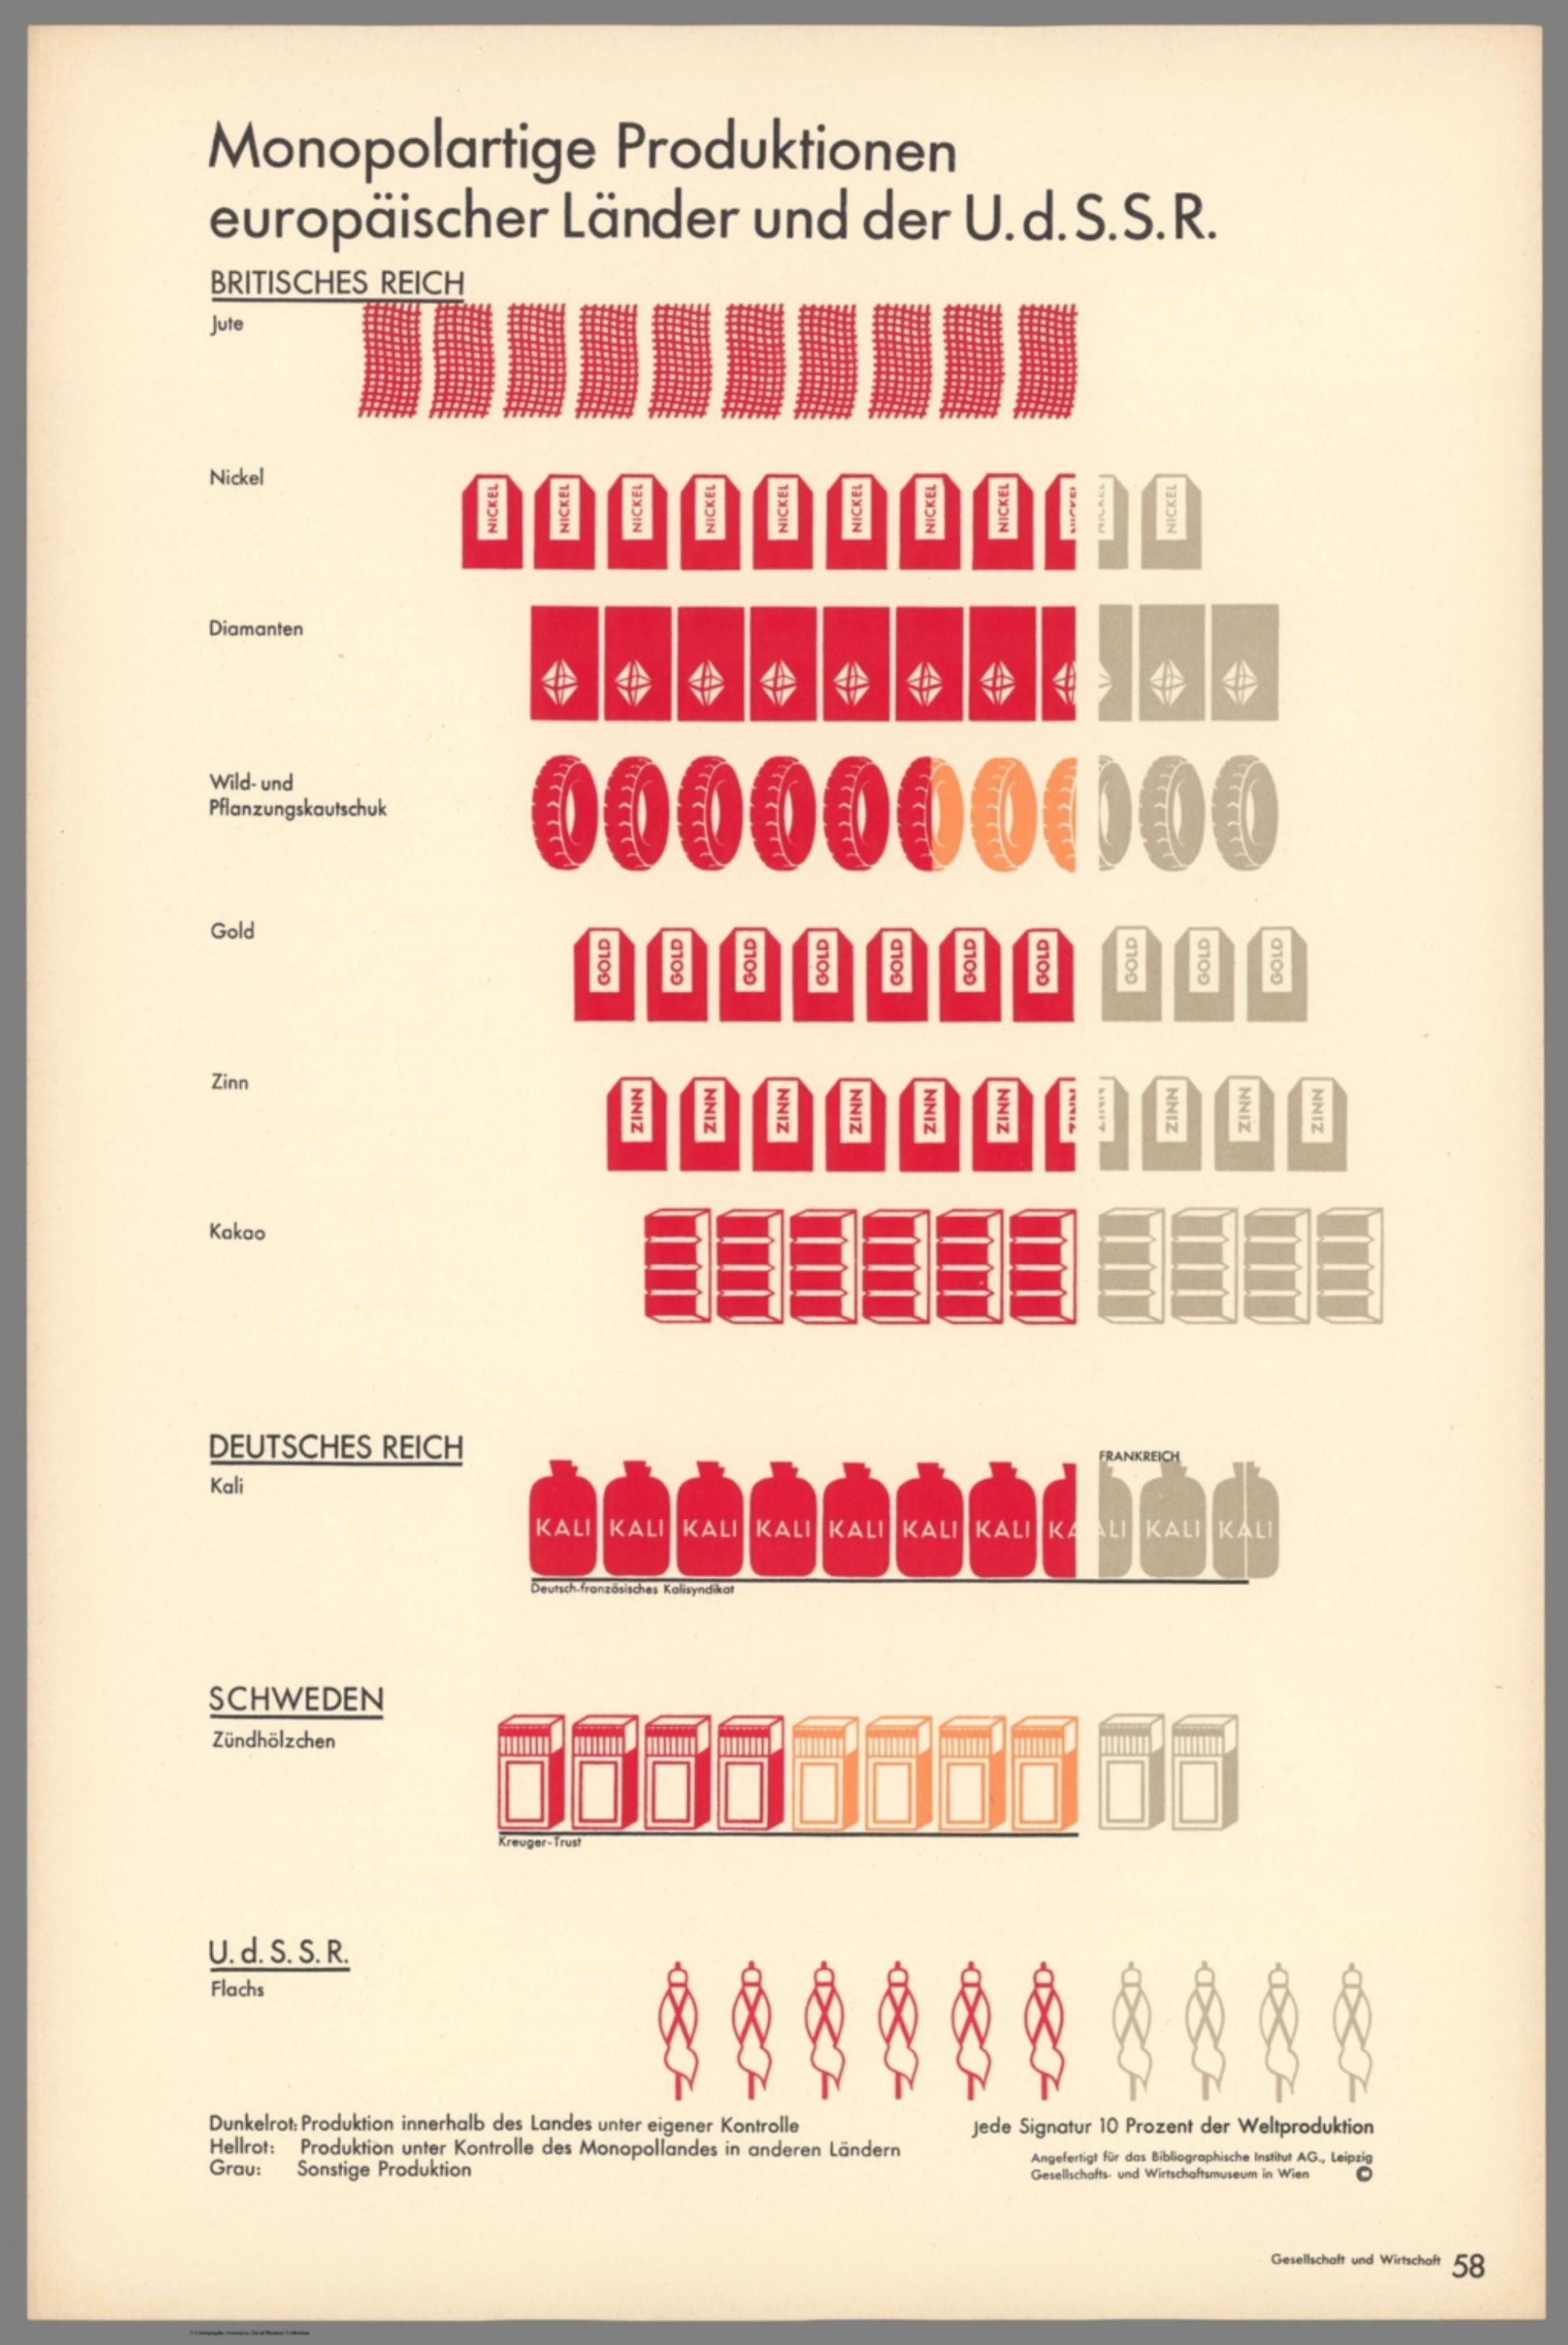
Gesellschaft und Wirtschaft: Bildstatistisches Elementarwerk - Monopolartige Produktionen europäischer Länder und der U.d.S.S.R [14080.061]
The pattern
This still is filed under Data as proof.
Define
A chart, map, or count that is the argument, not an illustration next to the argument.
Mechanism
Sighted evidence. The reader is asked to believe their eyes: a bar, a share, a spread on a map.
Verdict
The claim is comparative or quantitative and the figure can be read without a caption doing the sell.
Why it works
Every row is exactly ten symbols because each symbol is ten per cent of world production, so the row is a whole and the reader is reading share, not volume, with no percentage arithmetic. Splitting the red into two tones smuggles in a second variable - where the controlled production physically happens - without adding a second chart. Right-aligning the rows fixes the grey non-monopoly remainder in one column so the eye can scan straight down the page and rank the monopolies. Naming the Kali syndicate and the Kreuger trust on a bracket beneath the row attaches an institution to the abstraction and turns a statistic into an accusation.
Steal this when
Use this structure when the point is share of a market rather than size of a market, and when who controls the share matters as much as how big it is. The fixed ten-symbol row plus a two-tone split is the cleanest way to show concentration and hidden foreign control in the same line.