
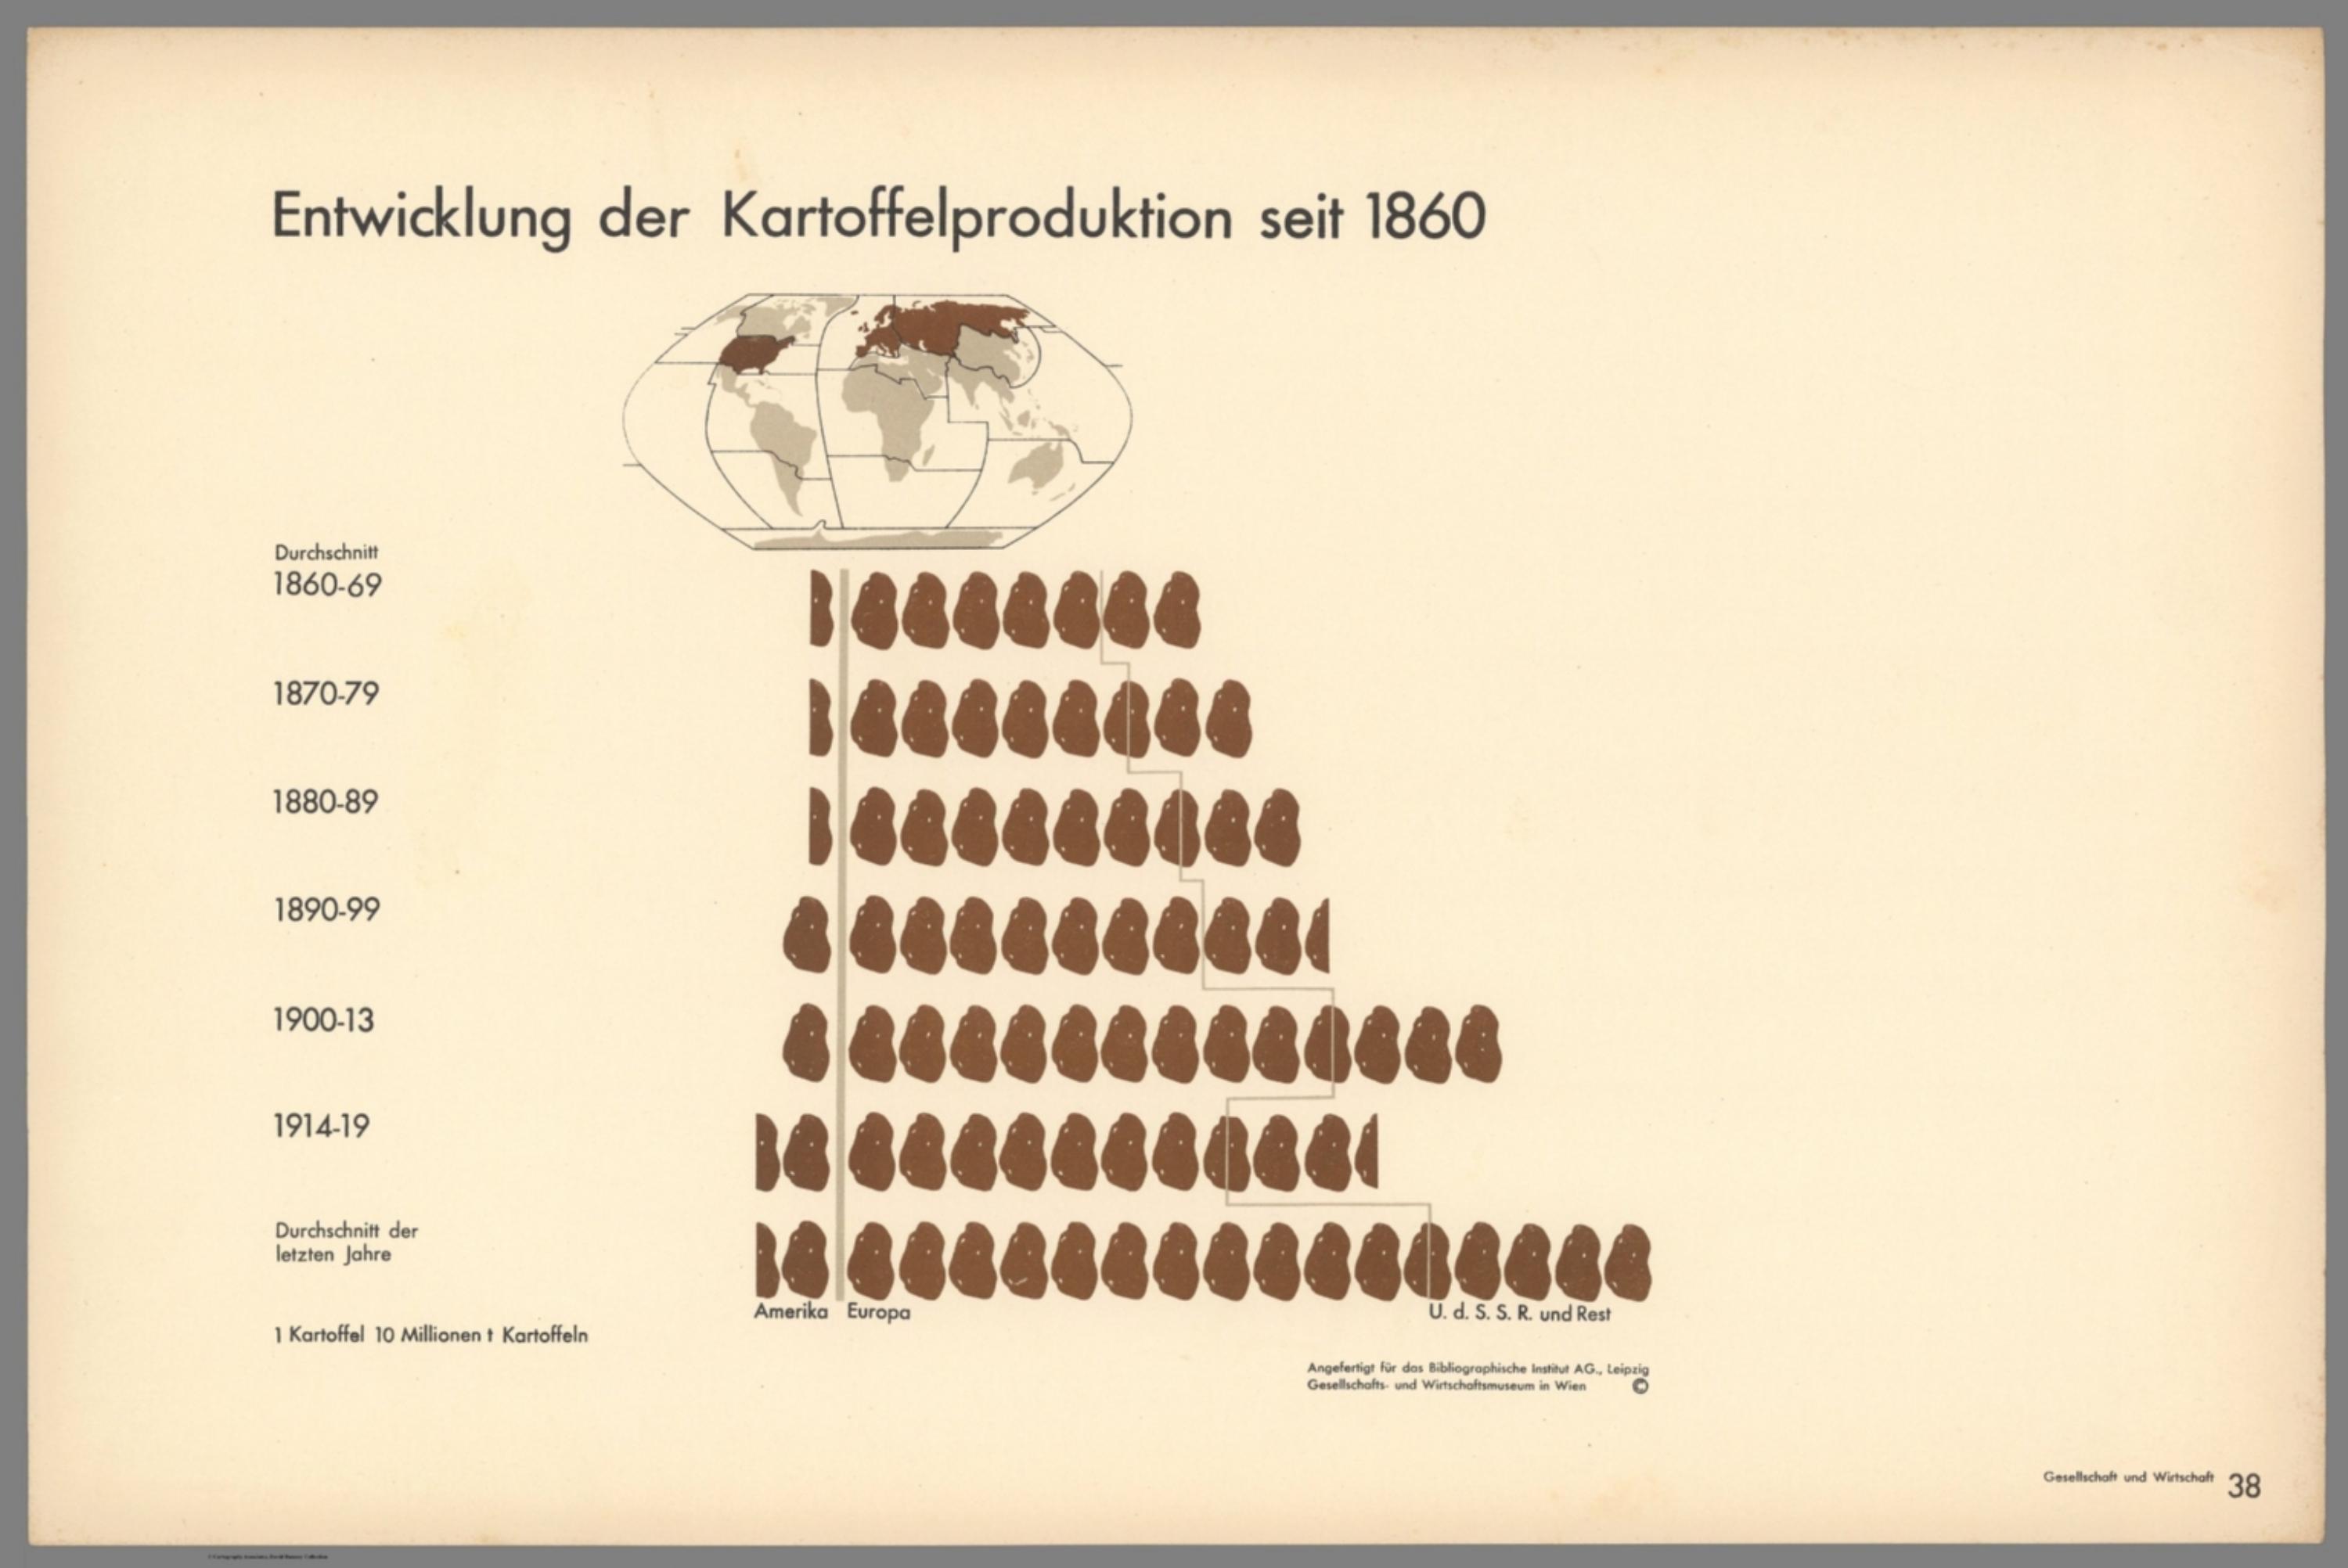
Gesellschaft und Wirtschaft: Bildstatistisches Elementarwerk - Entwicklung der Kartofffelproduktion seit 1860 : 1860-69-1870-79-1880-89-1890-99-1900-13-1914-19 [14080.041]
The pattern
This still is filed under Data as proof.
Define
A chart, map, or count that is the argument, not an illustration next to the argument.
Mechanism
Sighted evidence. The reader is asked to believe their eyes: a bar, a share, a spread on a map.
Verdict
The claim is comparative or quantitative and the figure can be read without a caption doing the sell.
Why it works
The quantity is carried entirely by repetition of one fixed-size symbol, so the reader counts rather than estimates area, which removes the perceptual error that scaled pictures introduce. Time runs down the page and volume runs across it, so the growth trend reads as a shape before any number is processed. The vertical divider rules turn the same row into a part-to-whole bar without adding a second chart type, so composition and total are read in one pass. The locator map at the top answers where before the rows answer how much, which means no legend hunting mid-read.
Steal this when
Use this when you must show a quantity growing over time and its composition shifting at the same time, for an audience that will not read a conventional axis. It is the right structure whenever the credibility of the claim depends on the reader being able to count the evidence themselves.