
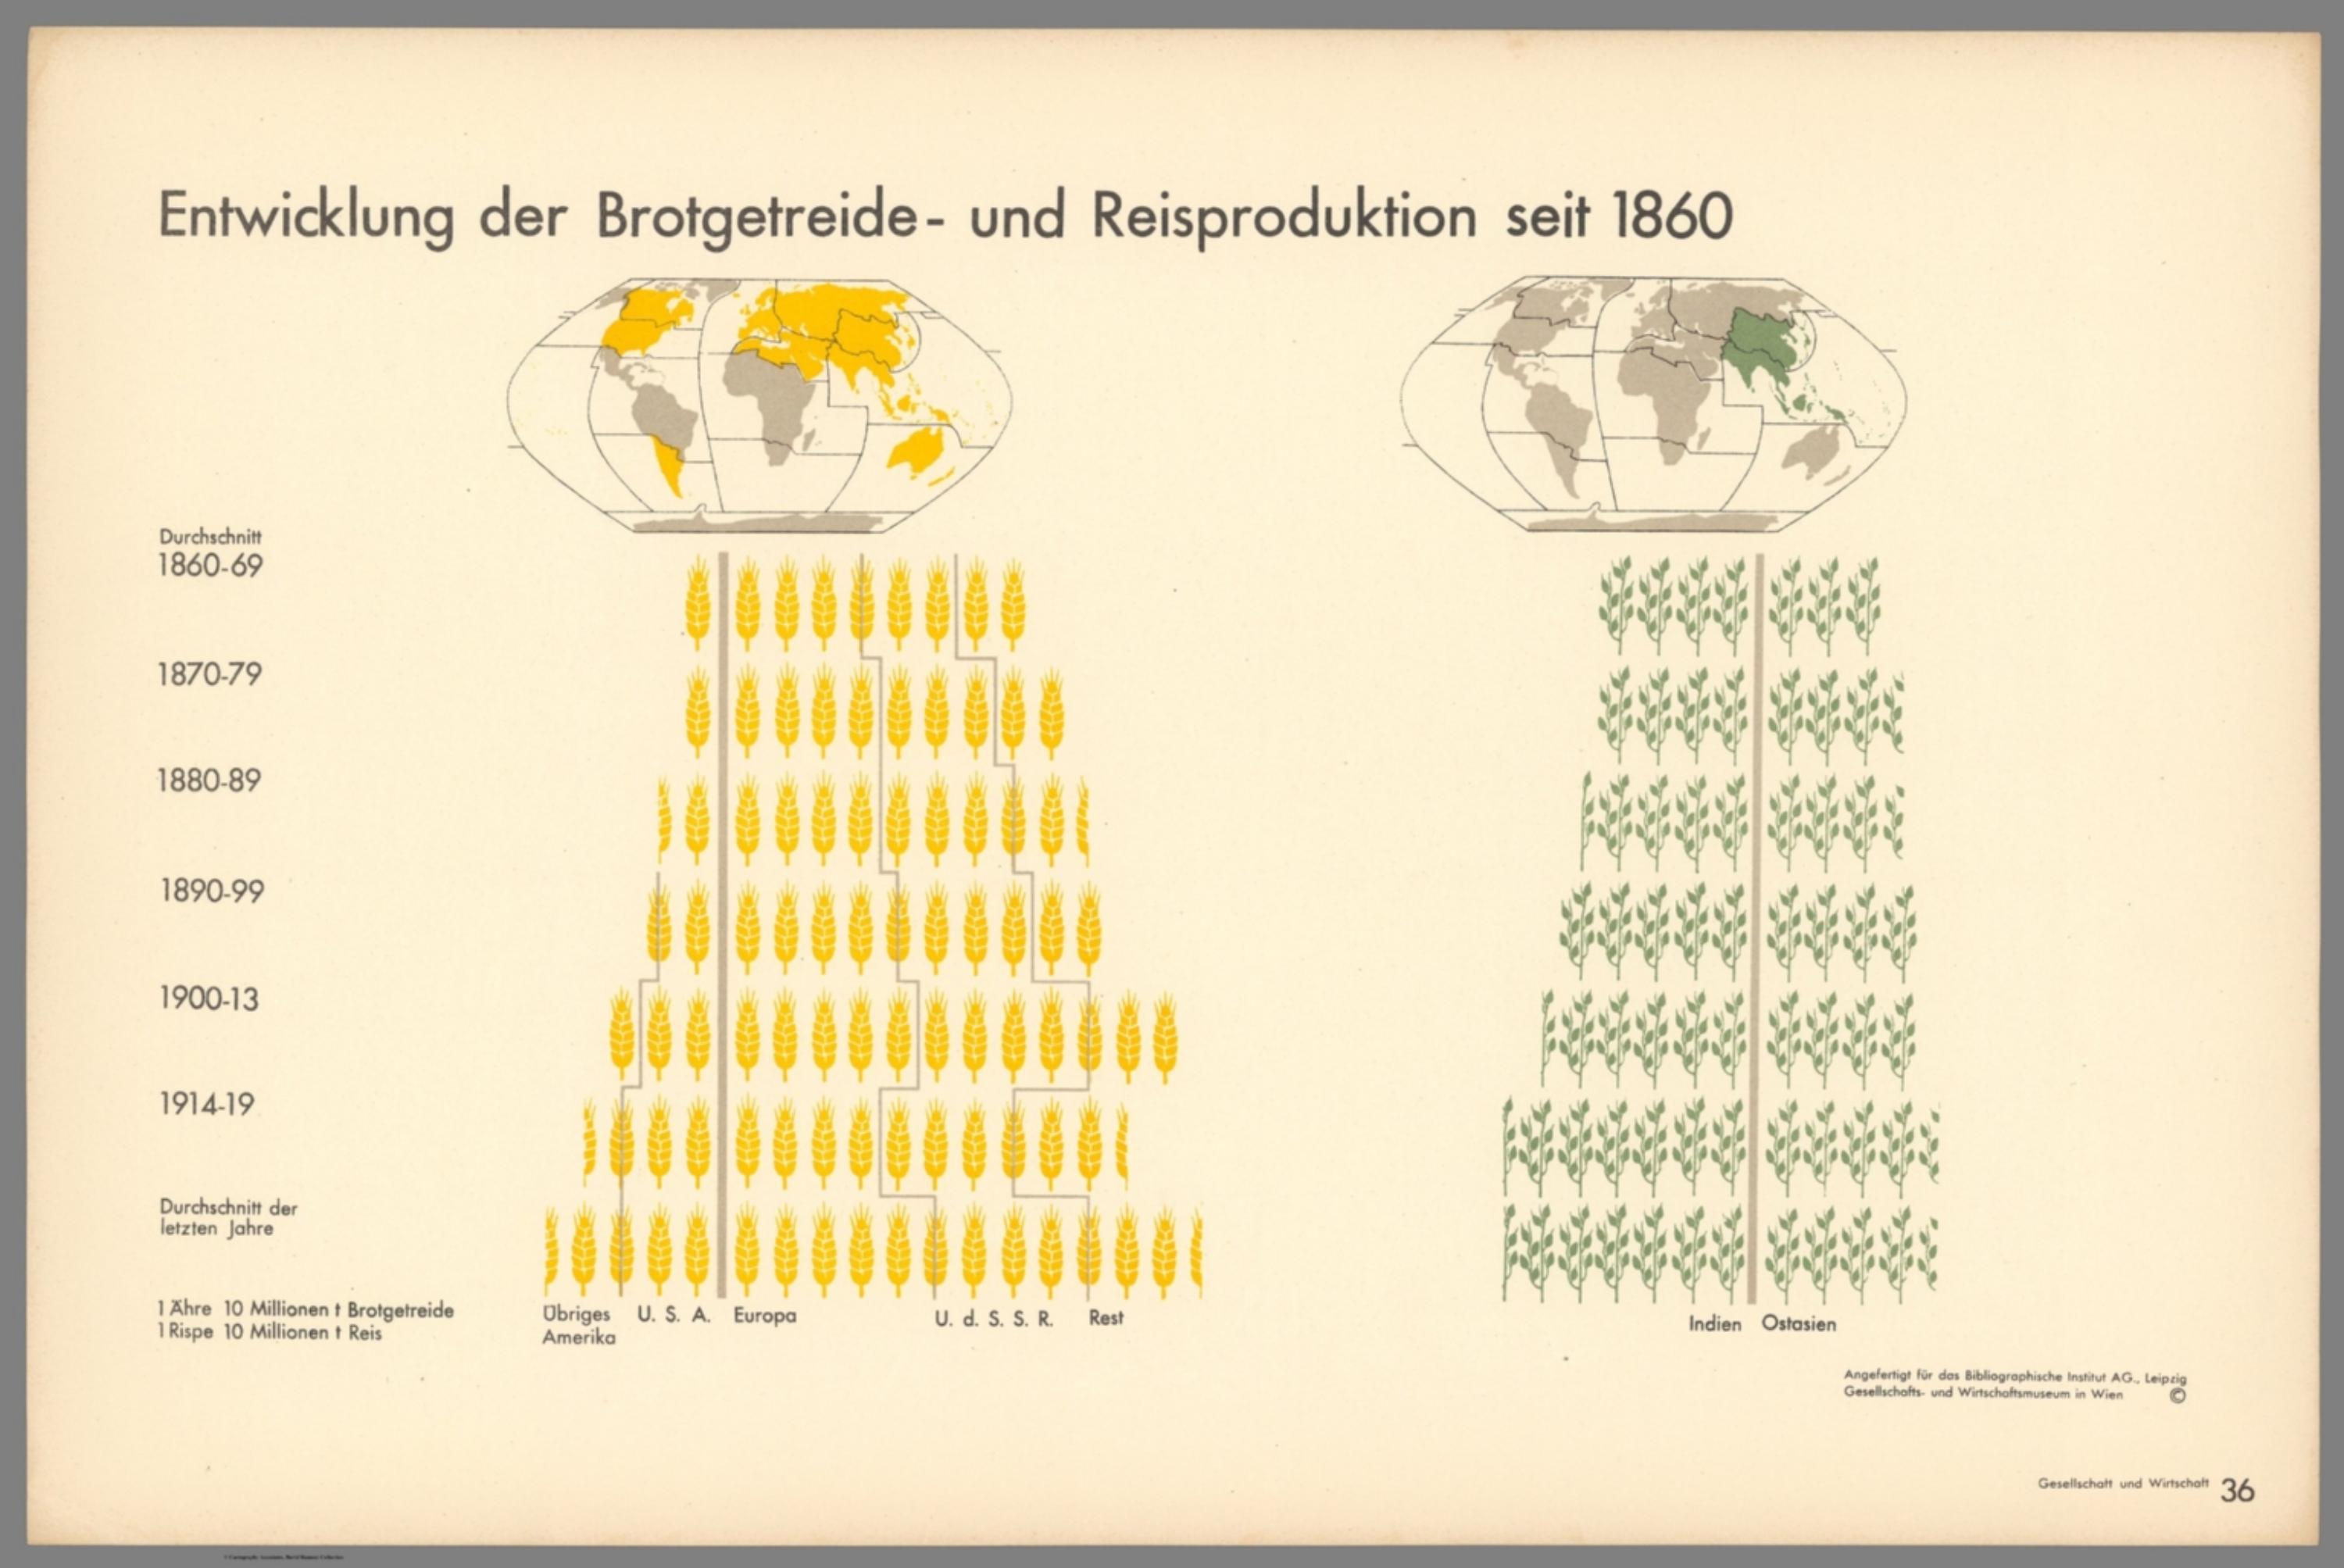
Gesellschaft und Wirtschaft: Bildstatistisches Elementarwerk - Entwicklung der Brotgetreide- und Reisproducktion seit 1860 : 1860-69-1870-79-1880-89-1890-99-1900-13-1914-19 [14080.039]
The pattern
This still is filed under Data as proof.
Define
A chart, map, or count that is the argument, not an illustration next to the argument.
Mechanism
Sighted evidence. The reader is asked to believe their eyes: a bar, a share, a spread on a map.
Verdict
The claim is comparative or quantitative and the figure can be read without a caption doing the sell.
Why it works
Time runs downward as rows of a fixed unit, so the growth curve is expressed as physical length and needs no axis, no gridlines and no numbers. The thin step lines that thread down through the rows are the clever part: they segment each row by region while letting the eye still read the row as a single length, giving a stacked breakdown without breaking the count. Putting the two crops side by side in identical construction, and at the same value per symbol, makes them directly comparable although their geographies share almost nothing. The two locator maps above the blocks answer the question of where each crop is grown, keeping that variable out of the counting area entirely.
Steal this when
Use this when a long time series must be shown to a non-technical audience and the composition of the growth matters as much as the total: rows per period, one unit symbol, a light dividing line for the breakdown, and a small locator map for the where.