
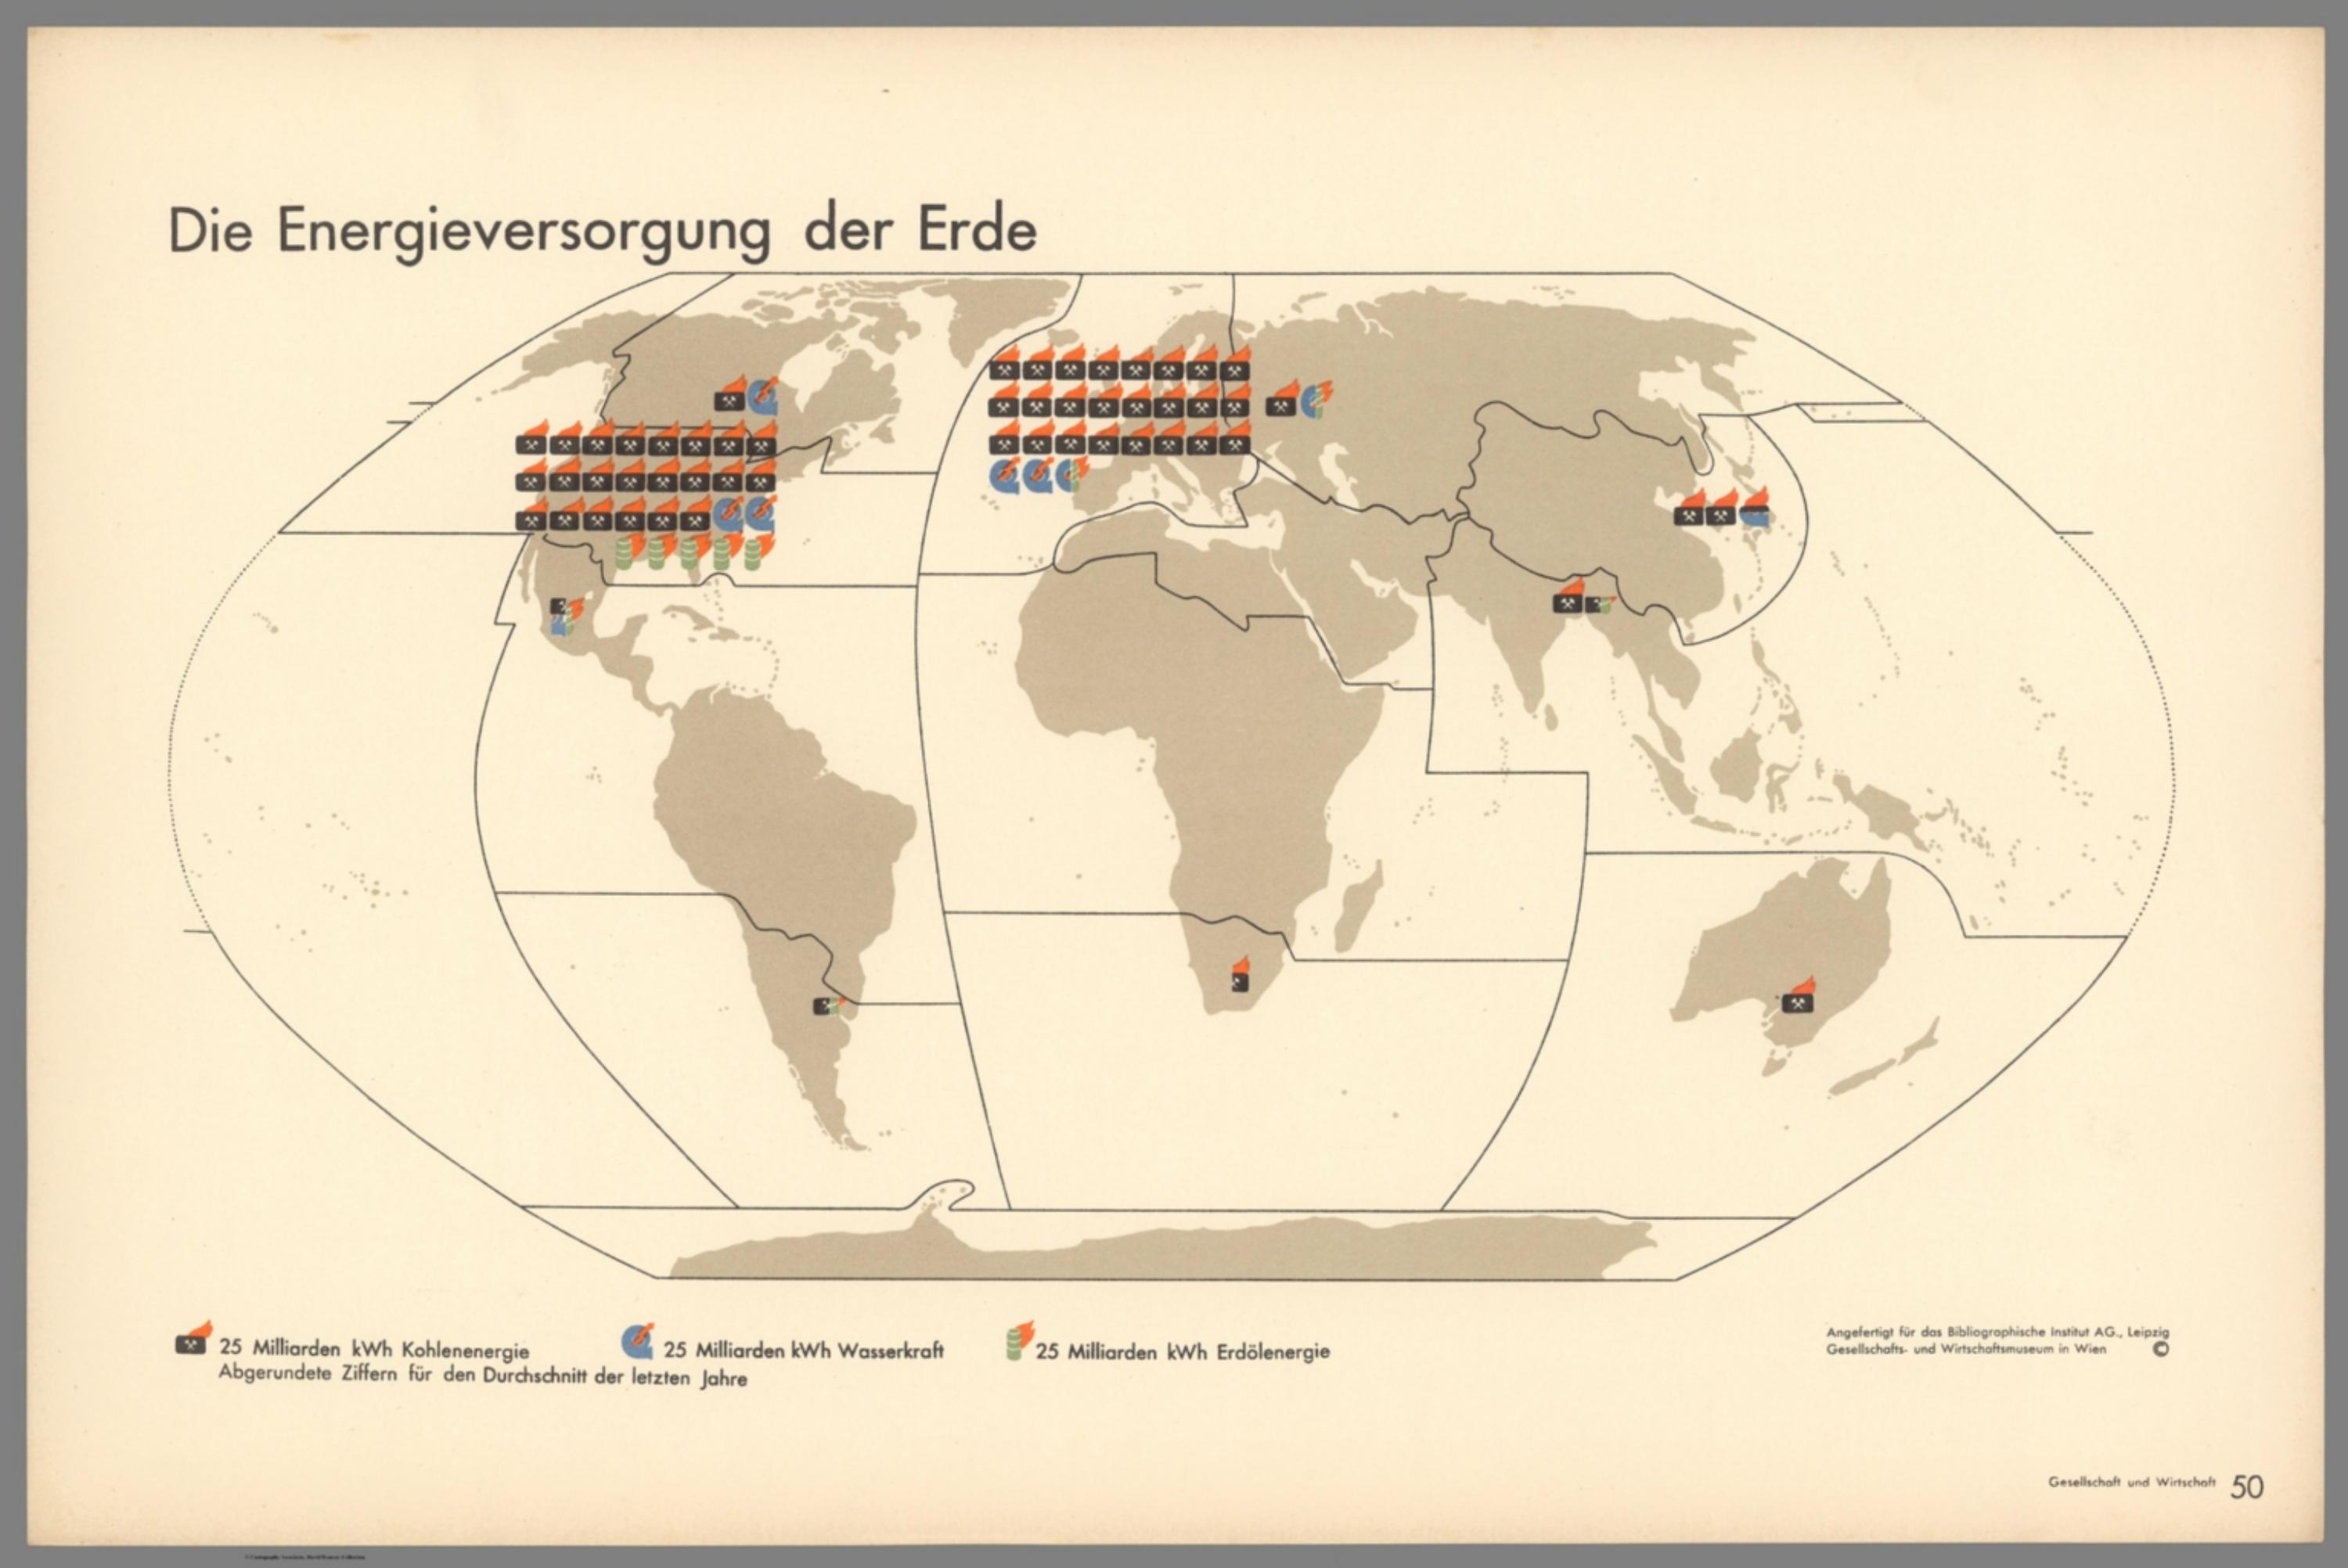
Gesellschaft und Wirtschaft: Bildstatistisches Elementarwerk - Die Energieveersorgung der Erde [14080.053]
The pattern
This still is filed under Data as proof.
Define
A chart, map, or count that is the argument, not an illustration next to the argument.
Mechanism
Sighted evidence. The reader is asked to believe their eyes: a bar, a share, a spread on a map.
Verdict
The claim is comparative or quantitative and the figure can be read without a caption doing the sell.
Why it works
Converting coal, water and oil to one shared energy unit is the analytical move, and the graphic only has to repeat it, so incommensurable sources become directly countable. Each source gets its own silhouette rather than a colour swatch, which survives the small size and the busy map background where a colour key would fail. Emptiness carries as much meaning as density here, because the untouched continents are drawn in the same frame and the reader sees absence, not missing data. Running the key as one horizontal line under the map keeps the three definitions adjacent for comparison instead of stacking them into a hierarchy.
Steal this when
Use this when several unlike inputs have to be compared and a common unit exists: state the conversion in the key, give each input its own silhouette, and let the map show both concentration and absence.