
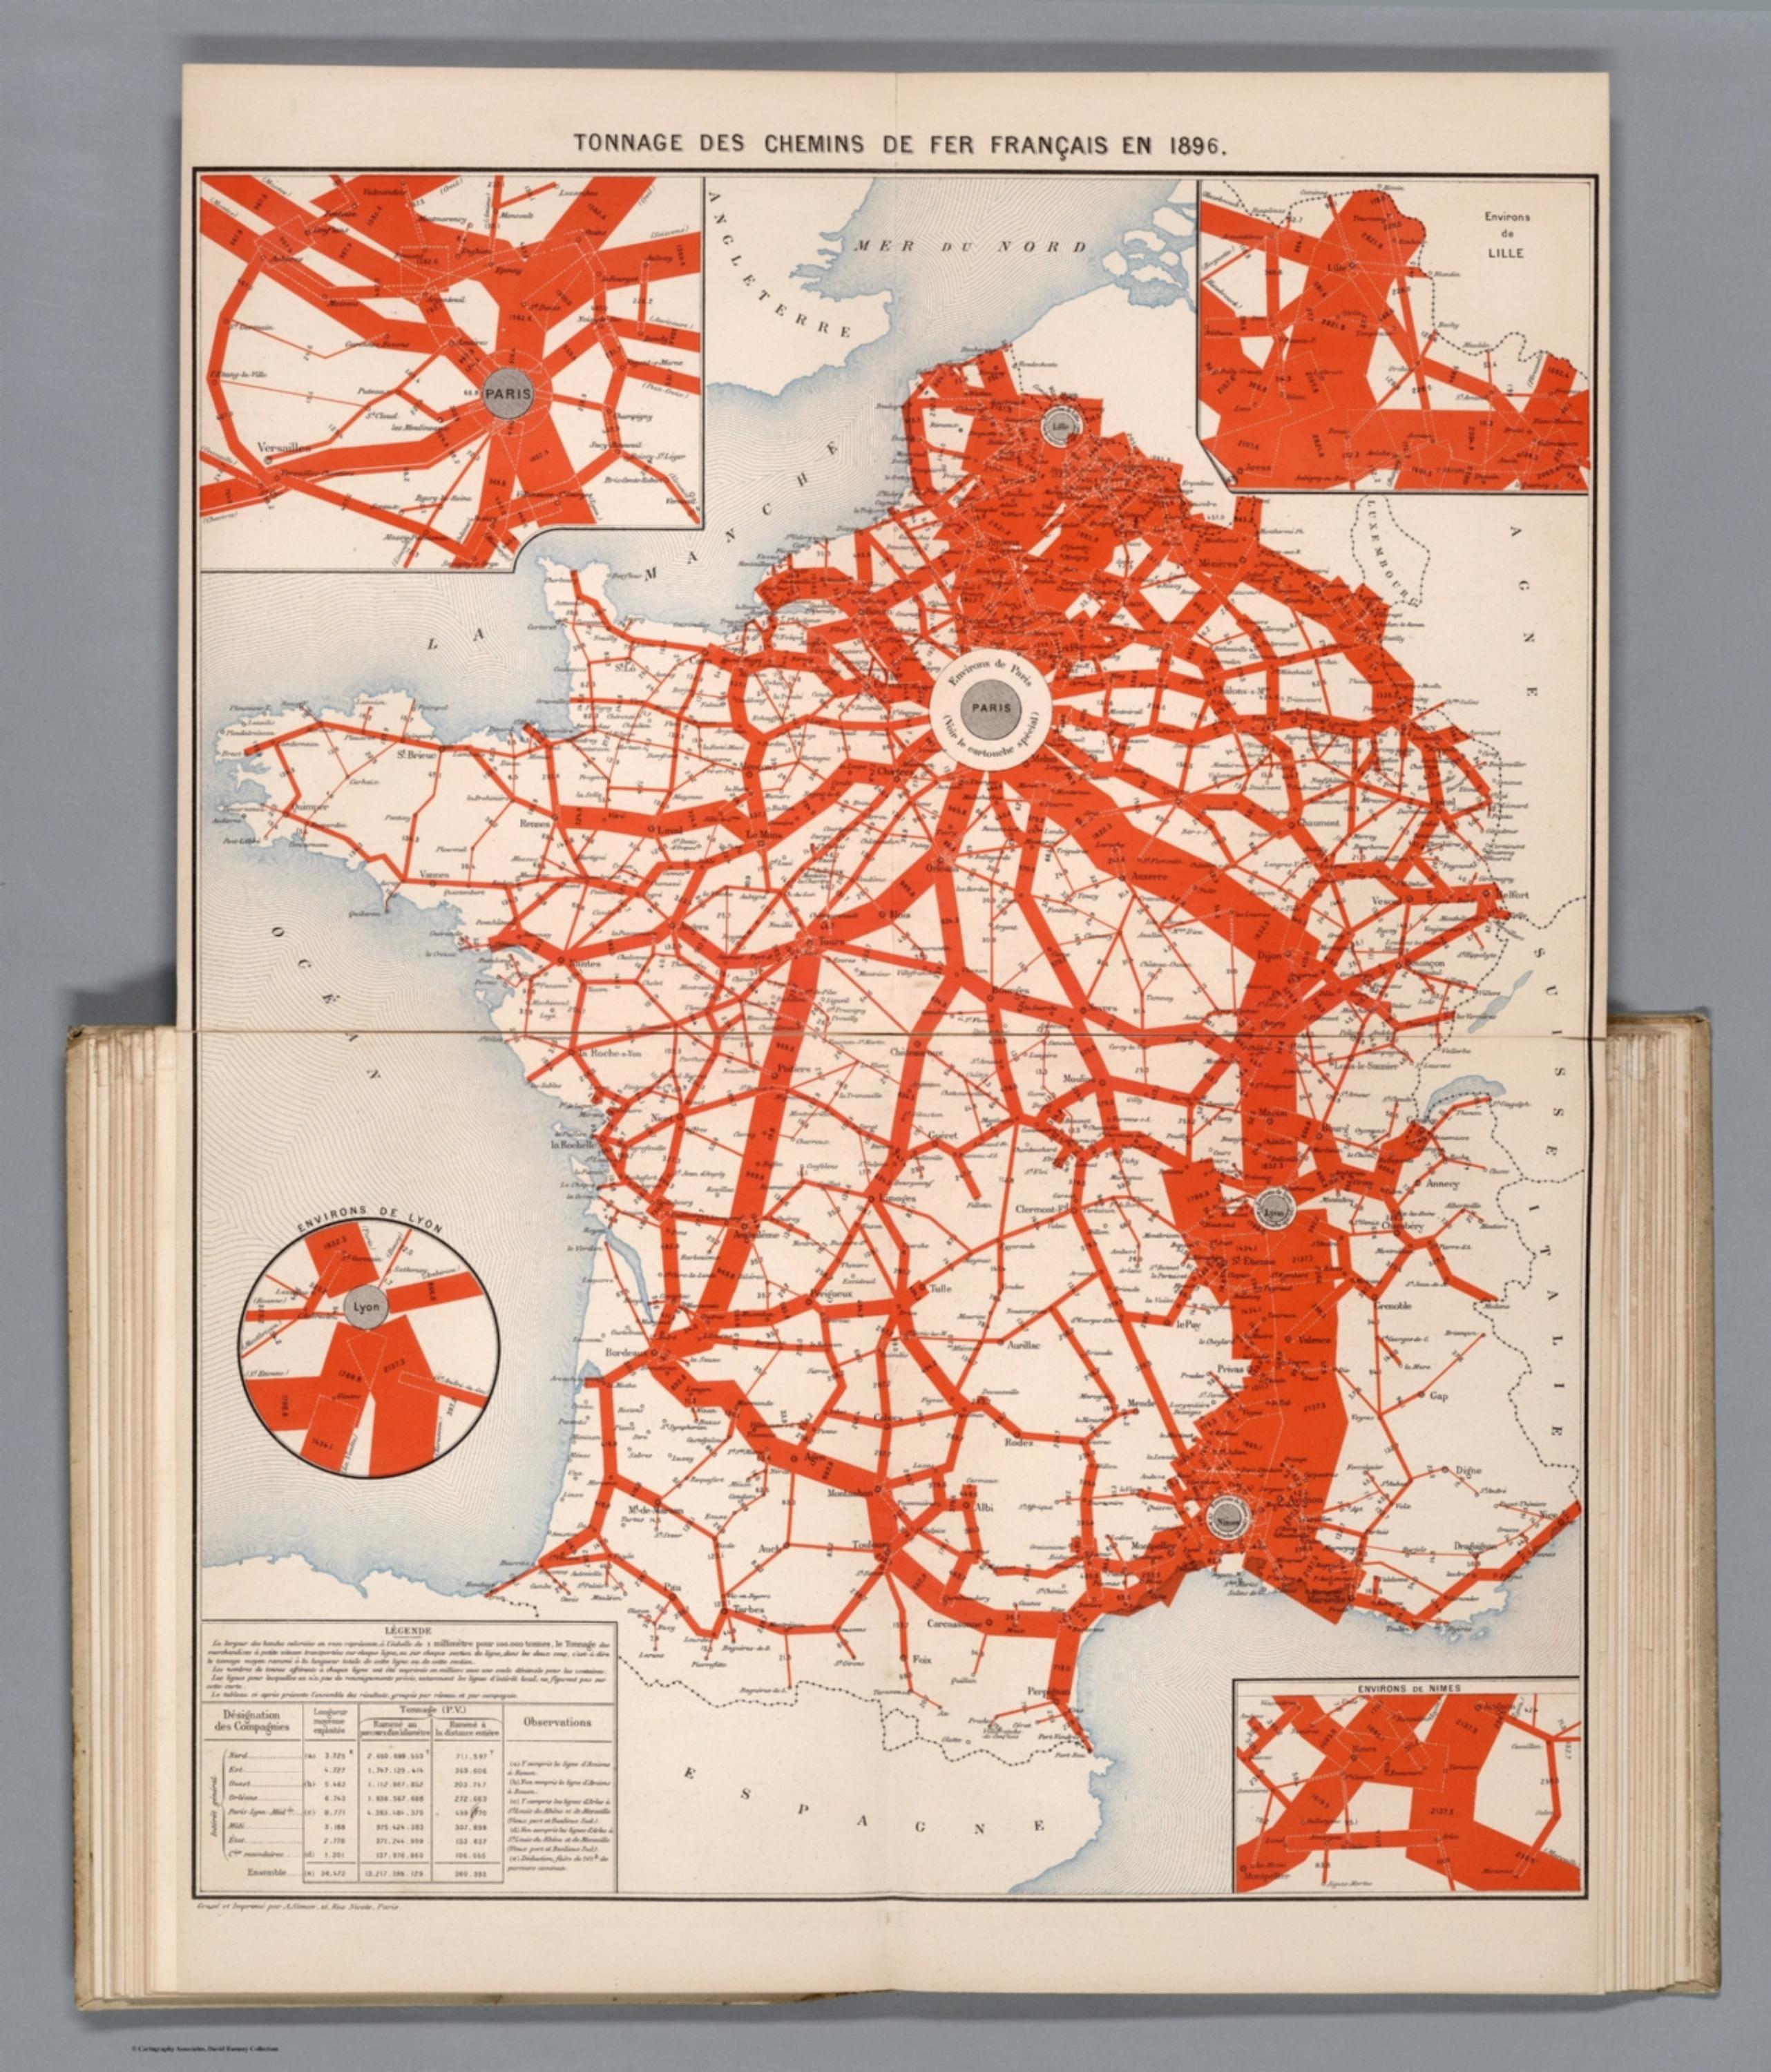
Album de Statistique Graphique - Tonnage de chemins de fer Francais en 1896. Grave et Imprime par A. Simon, Paris [13188.016]
The pattern
This still is filed under Data as proof.
Define
A chart, map, or count that is the argument, not an illustration next to the argument.
Mechanism
Sighted evidence. The reader is asked to believe their eyes: a bar, a share, a spread on a map.
Verdict
The claim is comparative or quantitative and the figure can be read without a caption doing the sell.
Why it works
The plate lets the encoding saturate on purpose. Where earlier sheets keep every band separable, here the coalescing of the north into a solid field is itself the message about industrial concentration, and the designer buys back the lost detail with four scale-break insets rather than by rescaling and flattening the whole country. Using a single hot ink against untouched paper means the read is pre-attentive - the reader sees the shape of French heavy industry before reading a single word. The footnoted observations column is what keeps a graphic this aggressive defensible line by line.
Steal this when
Use it when concentration is the finding and you would otherwise be tempted to log-scale or cap the values to keep the chart tidy. Let the dense region go solid, say so, and recover the detail with insets instead of compressing the scale.
If this library is useful, leave an email
We send new patterns, ads, and notes when we add them. Name and phone are optional.
You are on the list
We will write when we add more library material.