
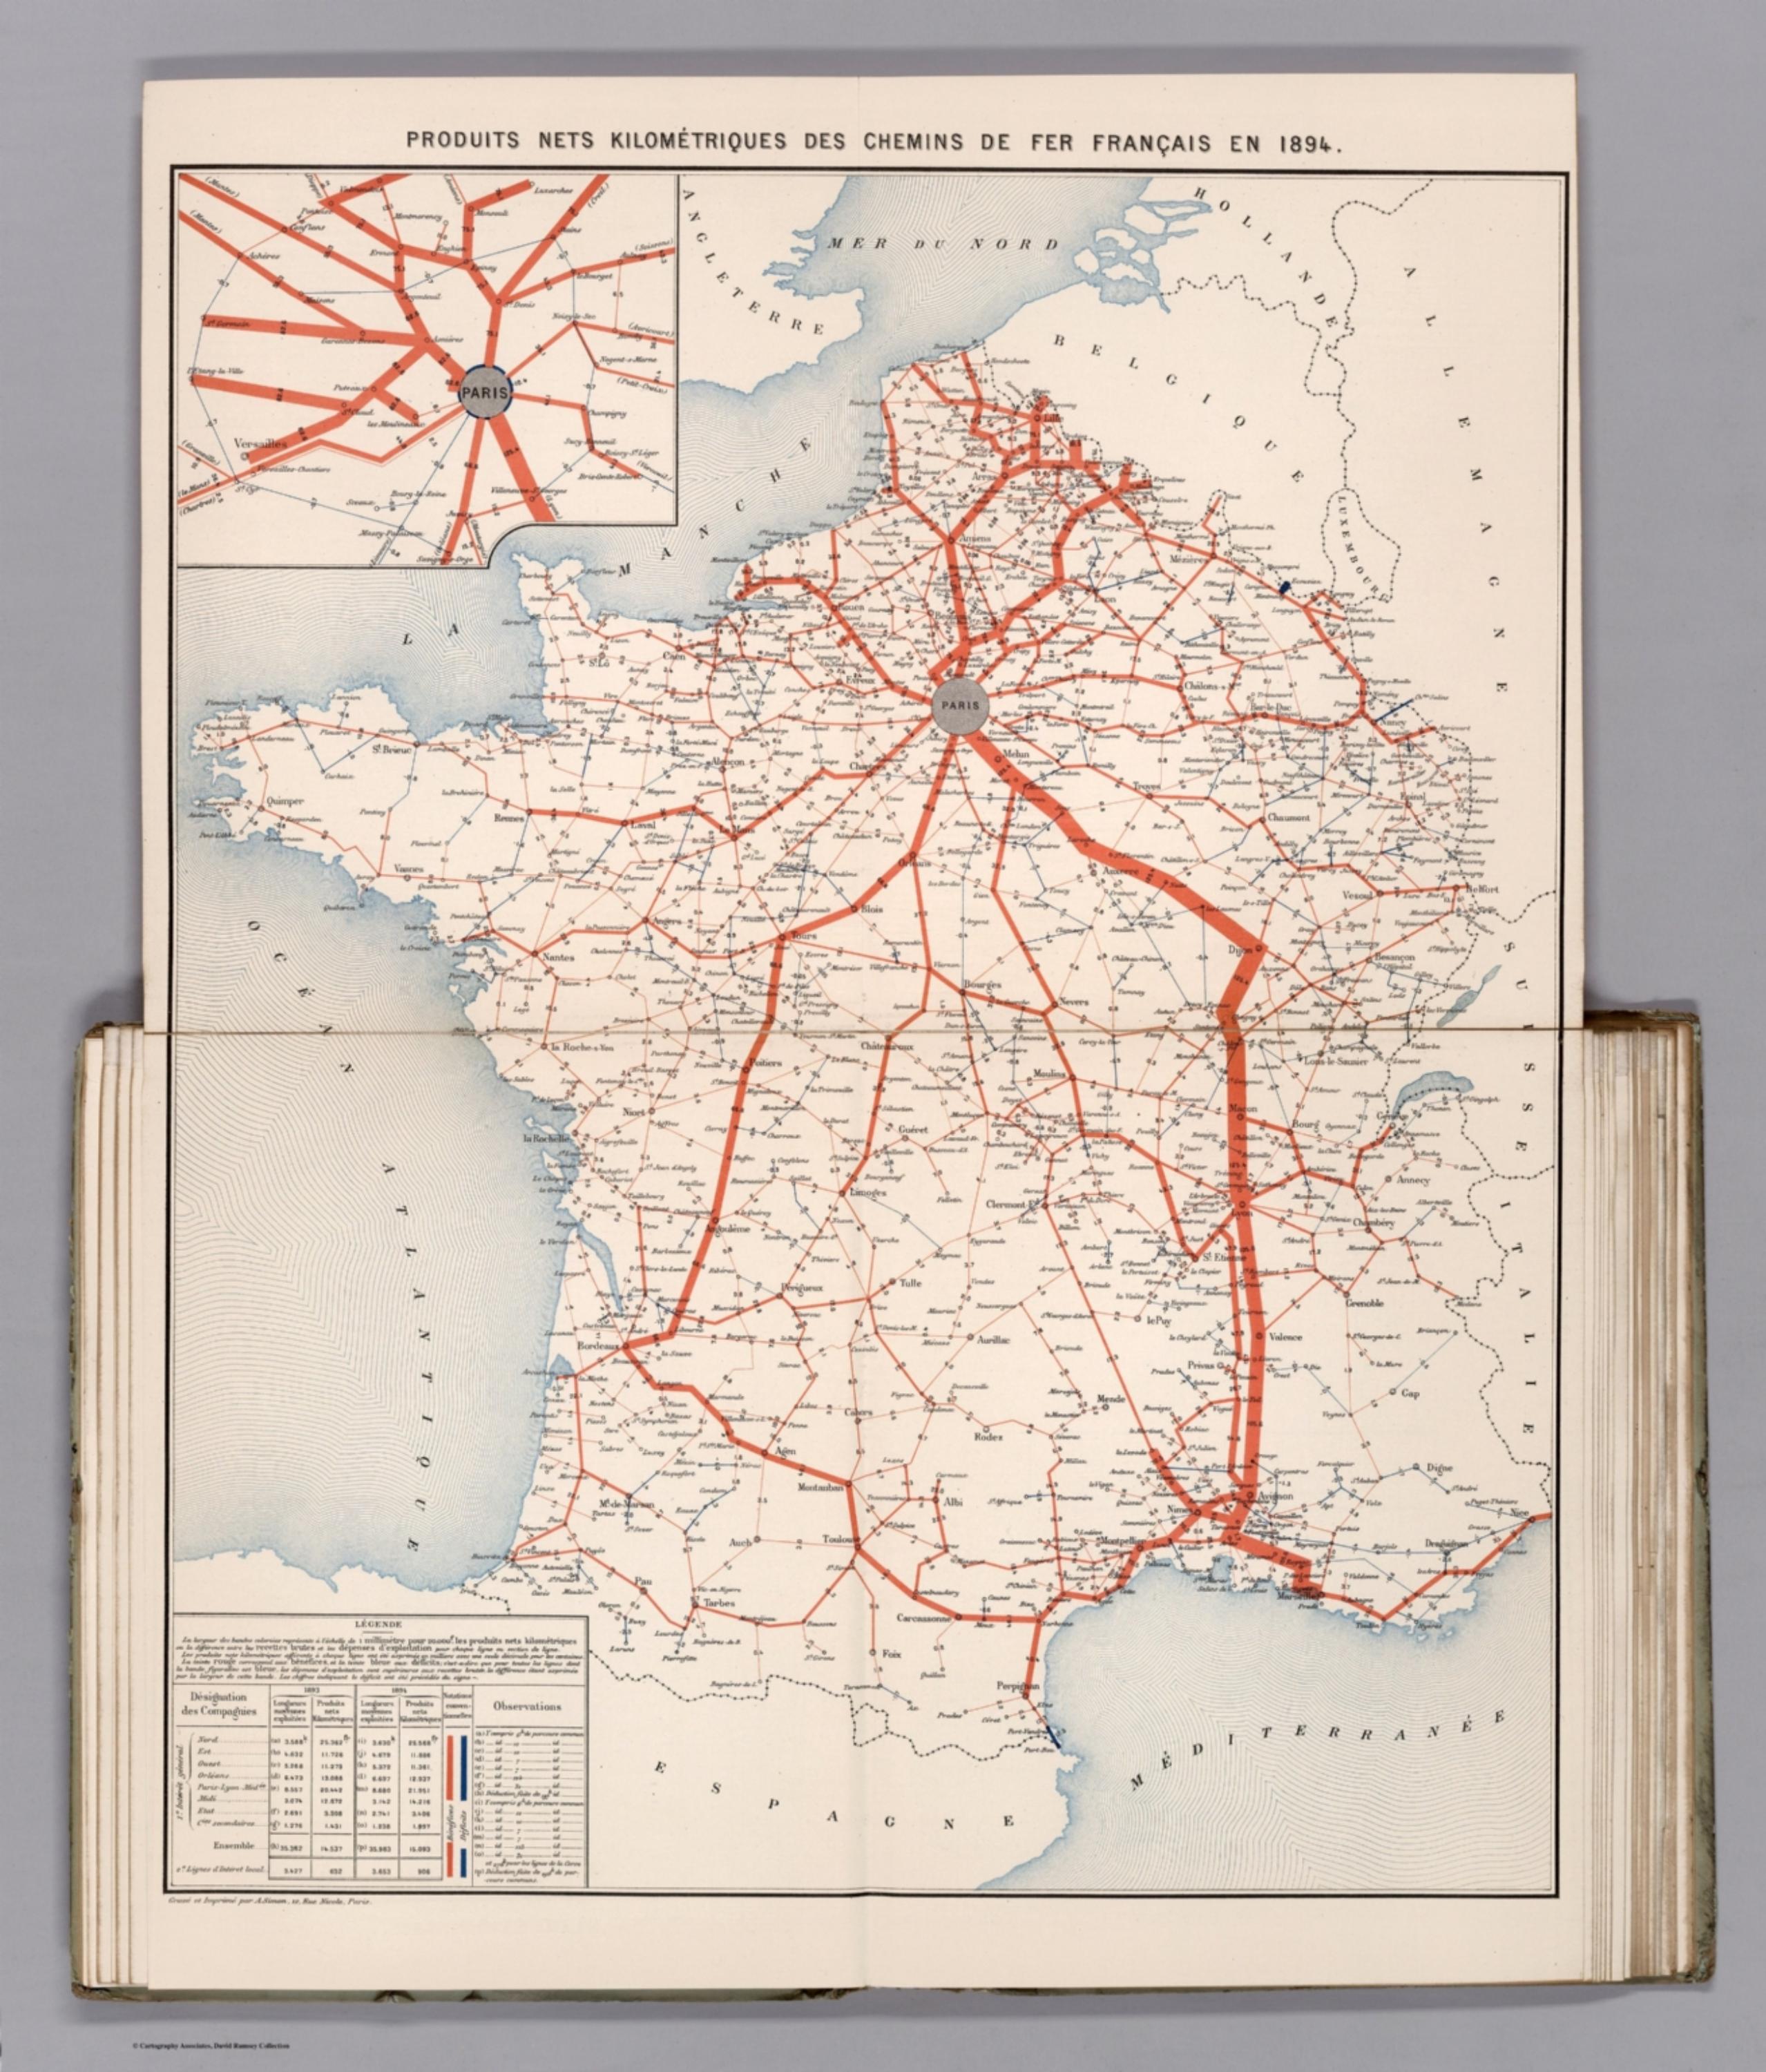
Album de Statistique Graphique - Produits Nets Kilometriques des Chemins de Fer Francais en 1894. (Net products of the French railroads in 1894.) [12525.018]
The pattern
This still is filed under Data as proof.
Define
A chart, map, or count that is the argument, not an illustration next to the argument.
Mechanism
Sighted evidence. The reader is asked to believe their eyes: a bar, a share, a spread on a map.
Verdict
The claim is comparative or quantitative and the figure can be read without a caption doing the sell.
Why it works
It is a deliberate companion piece: identical projection, identical encoding, different measure and different ink, so a reader who has the gross-receipts plate in the same volume can flip and see the gap between revenue and profit as a change in the shape of the same network. Holding every design variable constant except hue and the quantity is what makes the pair comparable at all. The near-invisible hairlines are not a failure of the rendering, they are the finding - width running to zero states unprofitability more plainly than any table of negative numbers.
Steal this when
Steal the pairing, not just the map: when you already have a revenue view, build the margin view on exactly the same geometry and change only the ink. Any audience that has read the first will read the second in seconds and see the delta without you narrating it.
If this library is useful, leave an email
We send new patterns, ads, and notes when we add them. Name and phone are optional.
You are on the list
We will write when we add more library material.