
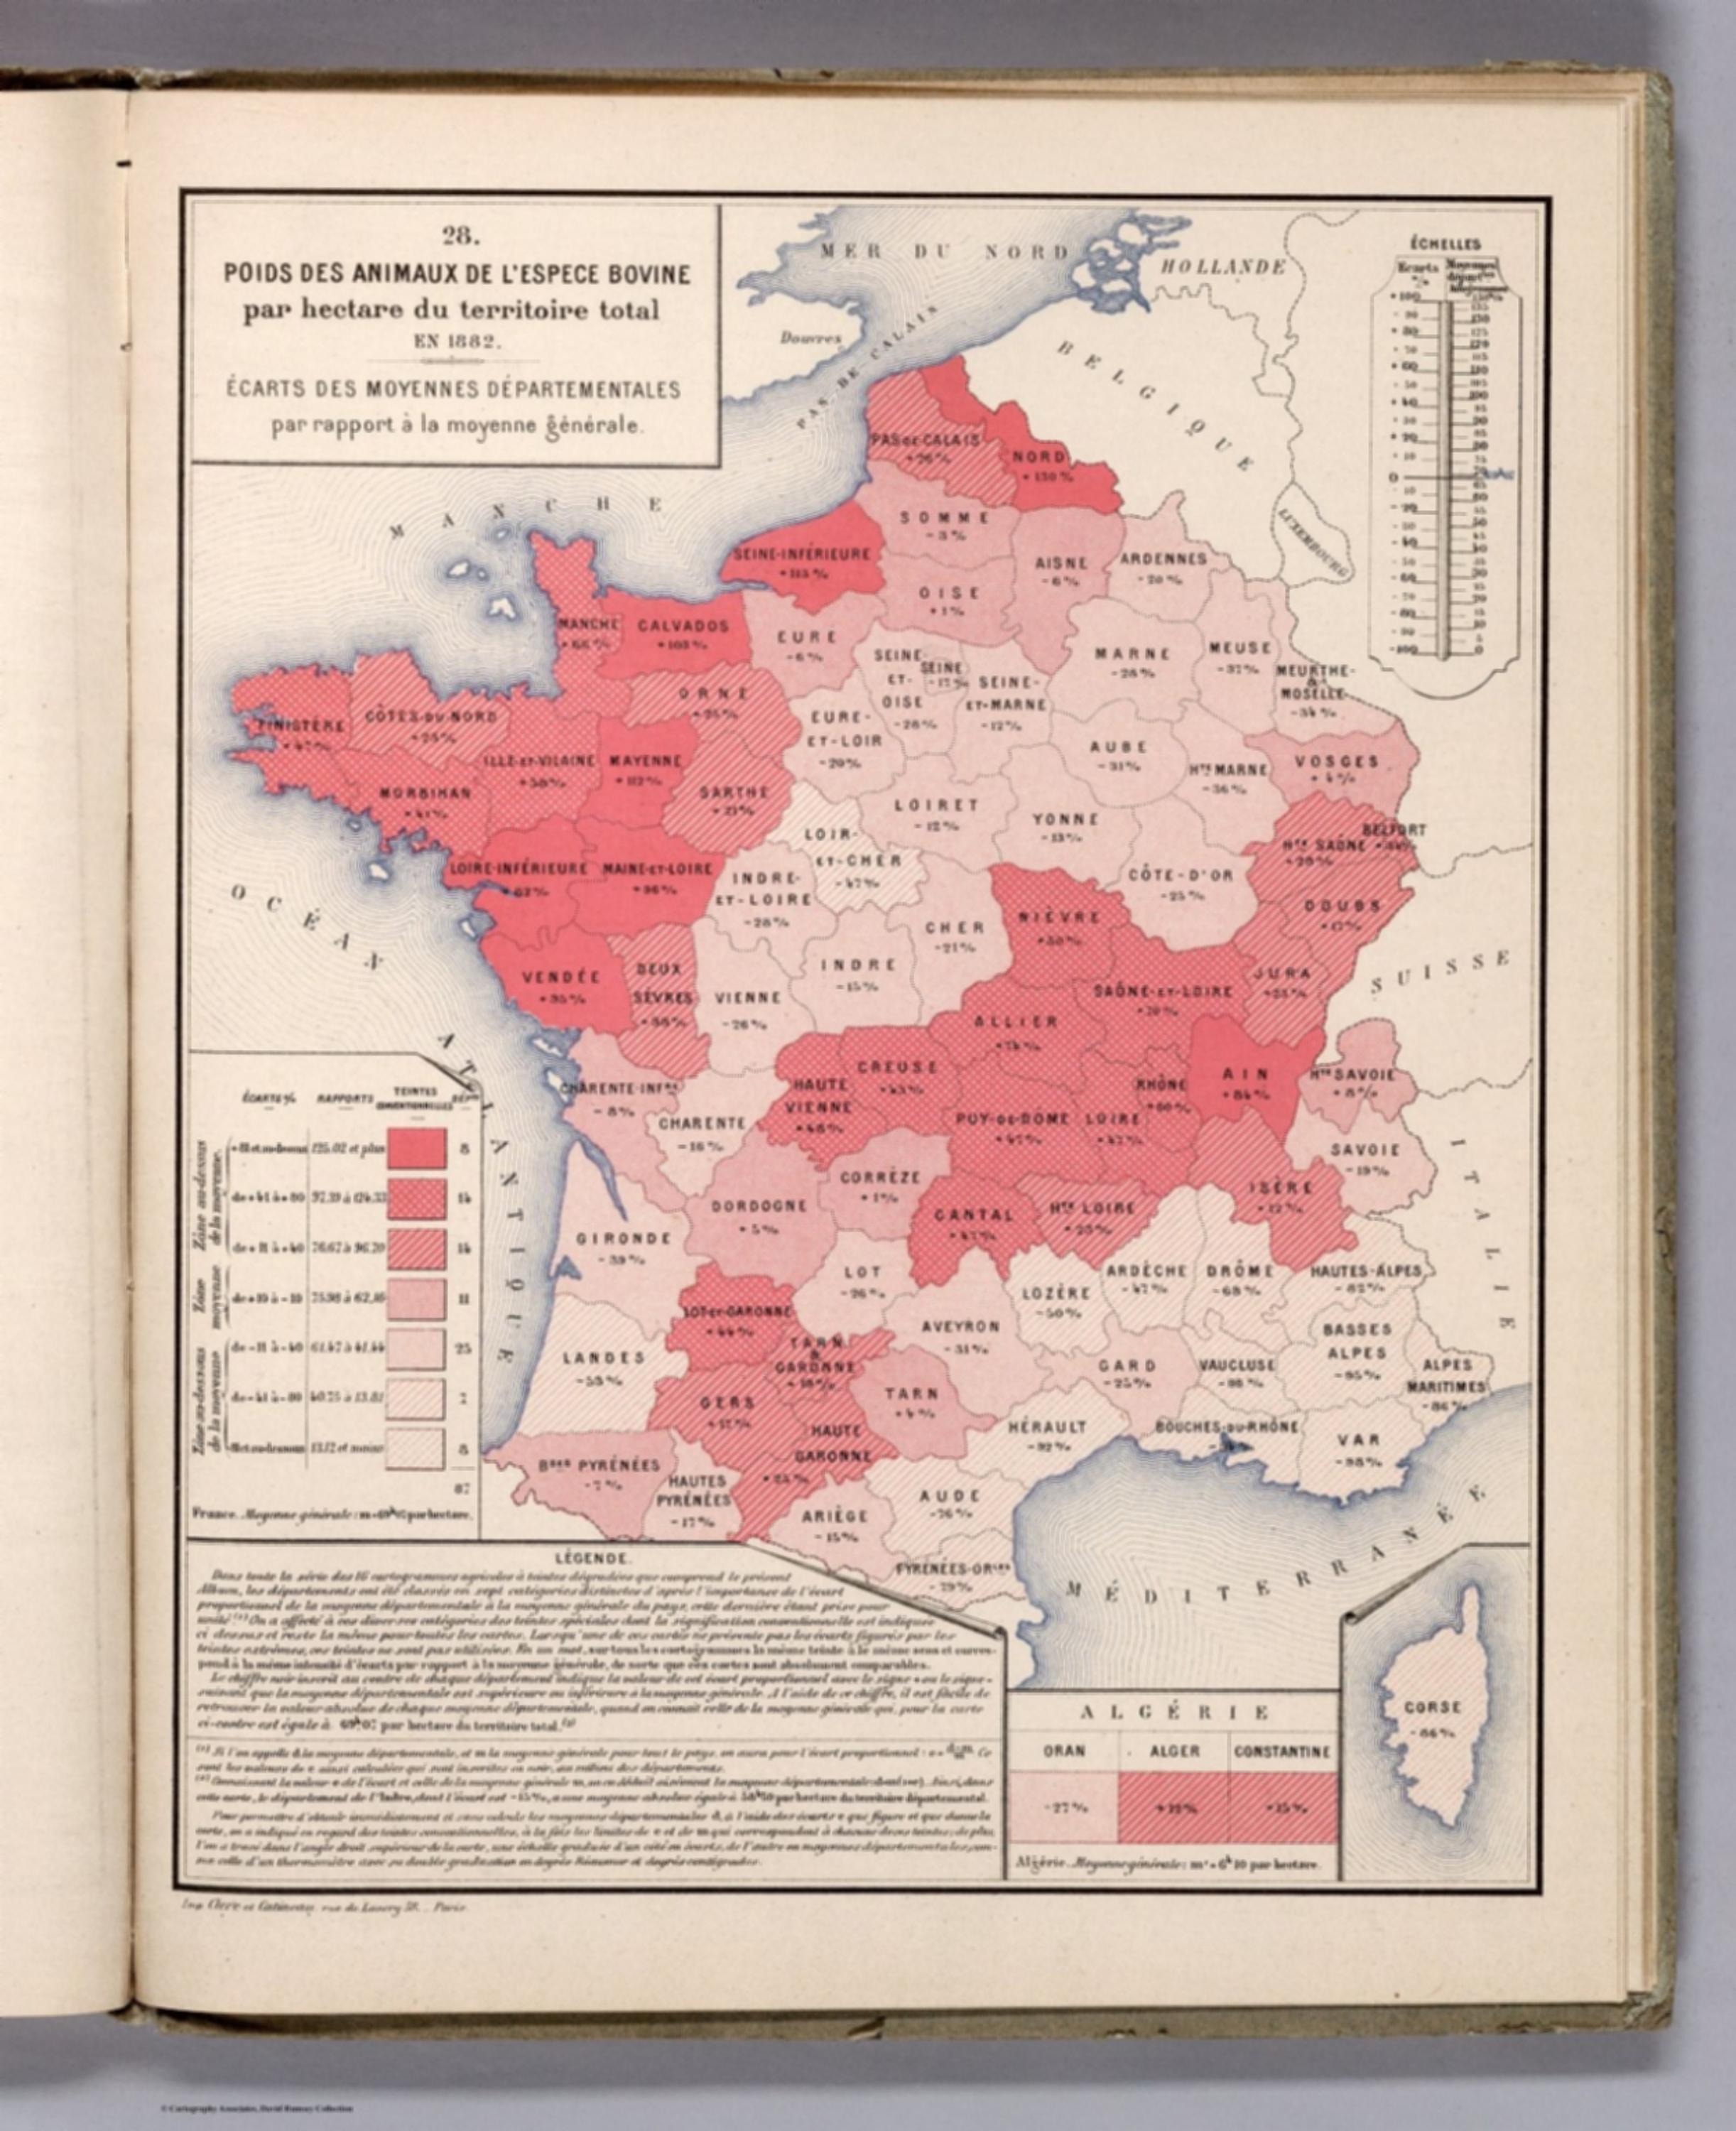
Album de Statistique Graphique - Poids des Animaux de L'Espece Bovine par Hectare du territoire total en 1882. (Weight of bovine animals per hectare of the total territory.) [12517.037]
The pattern
This still is filed under Data as proof.
Define
A chart, map, or count that is the argument, not an illustration next to the argument.
Mechanism
Sighted evidence. The reader is asked to believe their eyes: a bar, a share, a spread on a map.
Verdict
The claim is comparative or quantitative and the figure can be read without a caption doing the sell.
Why it works
Normalising to deviation from the national mean removes the population and area effects that make raw counts unreadable, and it converts the map into a ranking every reader already knows how to use. Printing the number inside each department means the tint carries the pattern while the figure carries the precision, so nothing is lost to classification. Hatching the intermediate grades solves the real failure of graduated tints - that neighbouring steps of one hue stop being distinguishable in print. Fixing one seven-step scale across all sixteen agricultural plates in the album makes the sheets stackable: the same tint means the same intensity on every map.
Steal this when
Use this when you are comparing many like units - regions, branches, cohorts, accounts - and the point is dispersion around a benchmark rather than absolute size. Lock one classified scale across the whole series before you draw the first chart, so a colour means the same thing on every page.
If this library is useful, leave an email
We send new patterns, ads, and notes when we add them. Name and phone are optional.
You are on the list
We will write when we add more library material.