
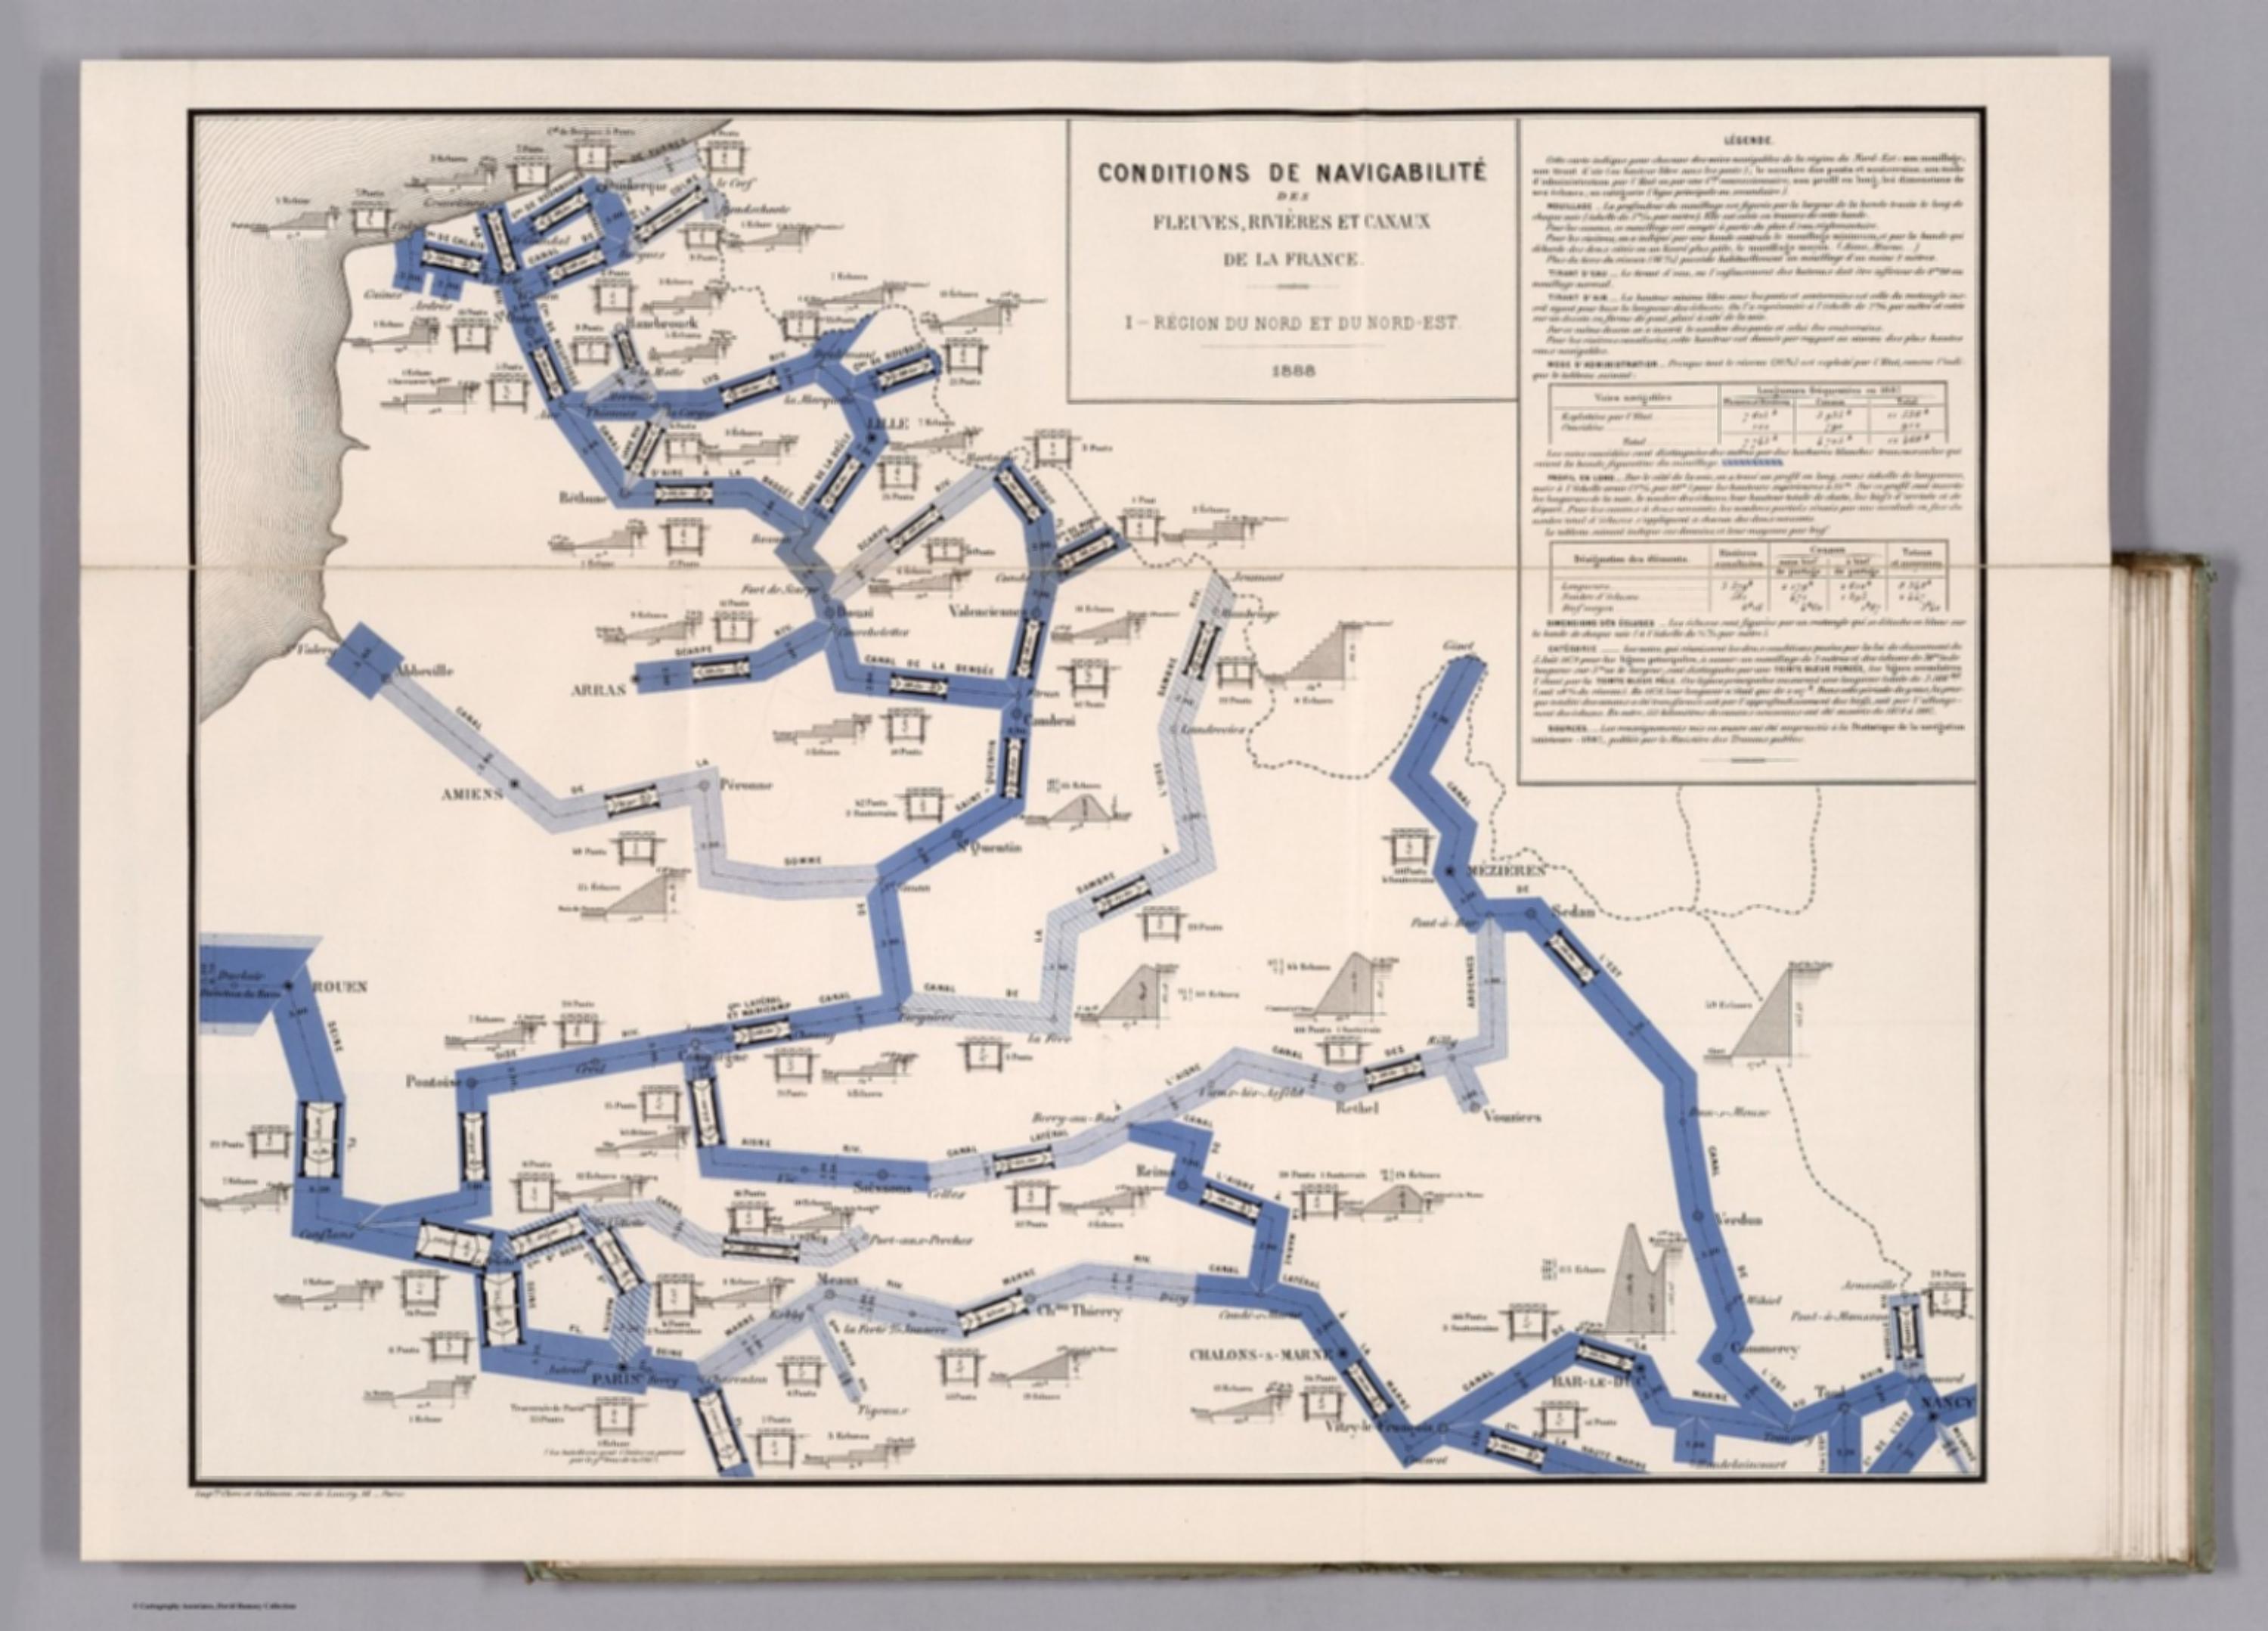
Album de Statistique Graphique - Conditions de Navigabilite des Fleuves, Rivieres et Canaux de la France. I. Region du Nord et du Nord-Est. 1888. (Navigability conditions of the inland waterways in 1887: Area of North.) [12519.018]
The pattern
This still is filed under Data as proof.
Define
A chart, map, or count that is the argument, not an illustration next to the argument.
Mechanism
Sighted evidence. The reader is asked to believe their eyes: a bar, a share, a spread on a map.
Verdict
The claim is comparative or quantitative and the figure can be read without a caption doing the sell.
Why it works
The map abandons geographic fidelity for topological clarity, which is the right trade when the question is what connects to what and at what clearance, not where exactly it runs. Band width encodes the single binding constraint - depth - so the bottleneck is visible before any number is read. The hundreds of vignettes are small multiples in the strict sense: one fixed template repeated at every section, so the reader learns the diagram once and can then compare any two stretches. Bold run-in heads in the legend turn a wall of text into a lookup table, letting an engineer jump to the one definition he needs.
Steal this when
Use this when a network's value depends on its worst clearance and the audience must be able to plan against it - logistics lanes, pipeline pressures, bandwidth, process capacity. Steal the vignette-per-segment pattern when each node has an internal profile that a single colour or number cannot express.