
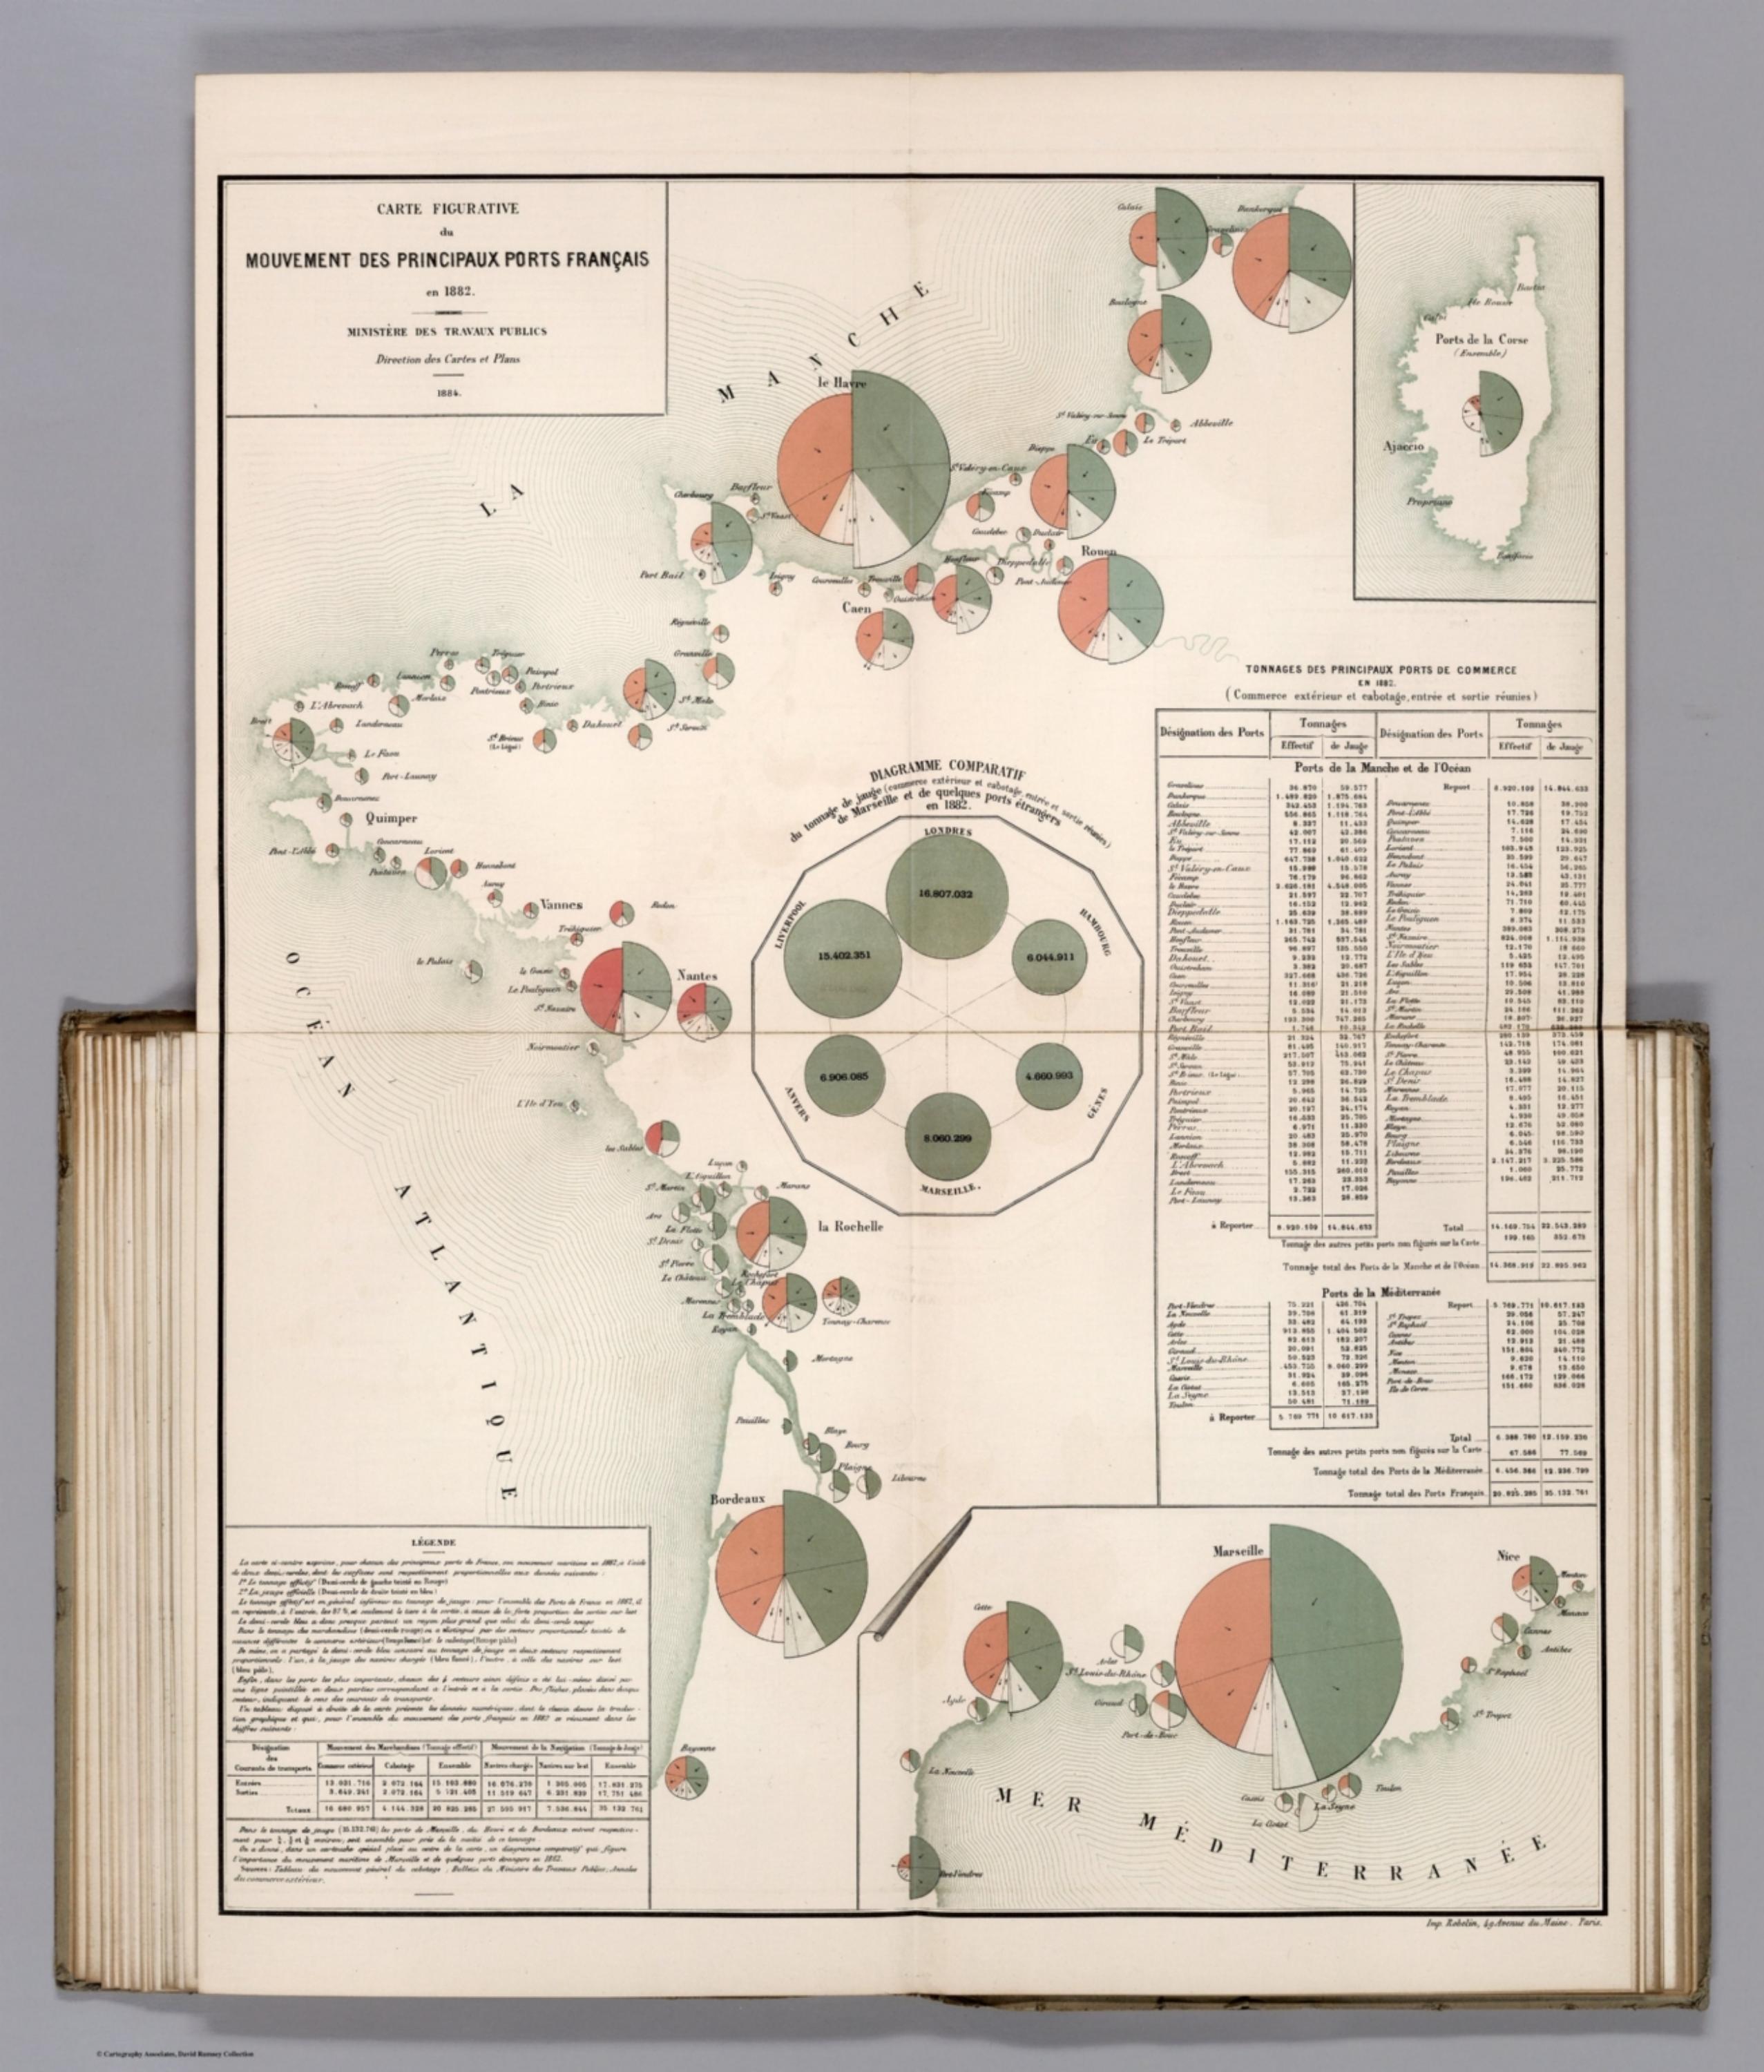
Album de Statistique Graphique - Carte Figurative du Mouvement des Principaux Ports Francais en 1882. (Movement of the principal French ports in 1882.) [12515.026]
The pattern
This still is filed under Data as proof.
Define
A chart, map, or count that is the argument, not an illustration next to the argument.
Mechanism
Sighted evidence. The reader is asked to believe their eyes: a bar, a share, a spread on a map.
Verdict
The claim is comparative or quantitative and the figure can be read without a caption doing the sell.
Why it works
Emptying the interior of the map converts unused space into layout space: the comparison diagram and the tables sit inside the country's own outline instead of being pushed to a second page. Area-coded circles give magnitude while the wedge split gives composition, so one mark answers how much and of what kind. Placing the international benchmark at the visual centre reframes the whole sheet - the reader is not comparing French ports with each other but with Liverpool and Hamburg. The exhaustive tonnage table on the same sheet insulates the graphic from the charge that a picture rounds away the truth.
Steal this when
Use this when the same entity type repeats along a geography and the argument is about relative scale and mix - branches, depots, stores, terminals. Steal the centre-of-the-map benchmark panel whenever the honest comparison is not internal but against outside competitors.