
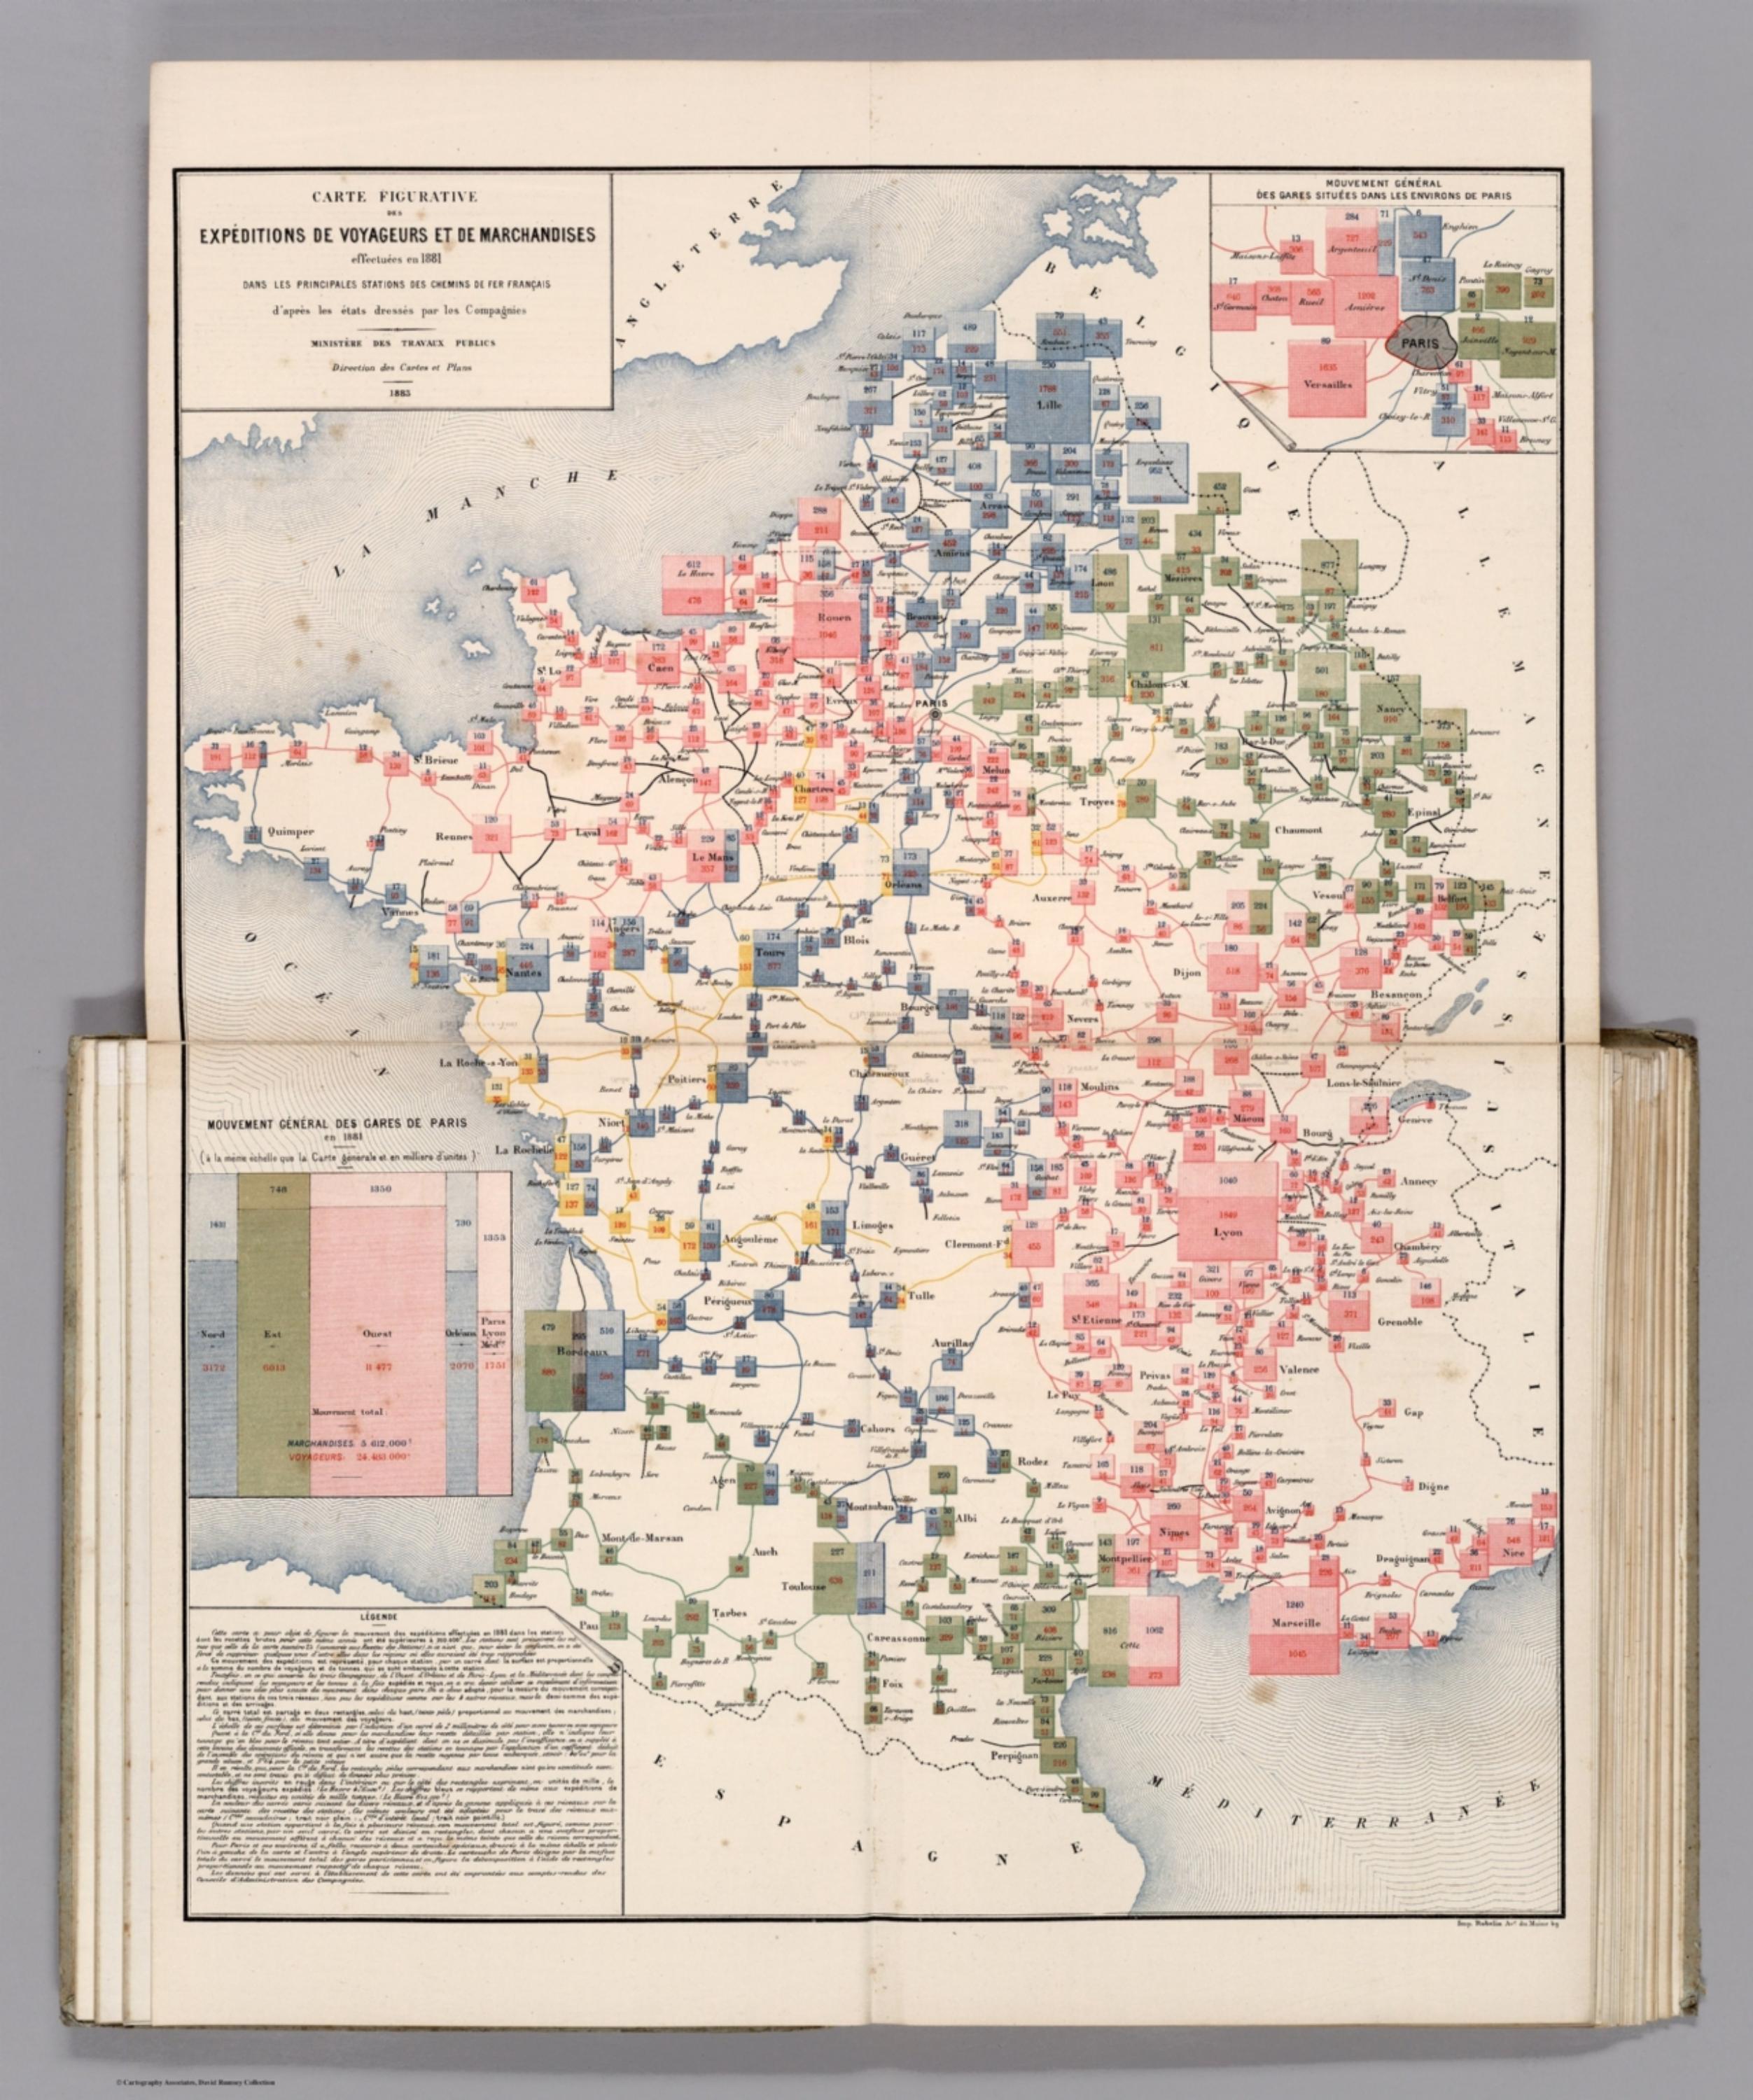
Album de Statistique Graphique - Carte Figurative des Expeditions de Voyageurs et de Marchandises Effectuees en 1881. (Expeditions of Travelers and Goods Made in 1881.) [12514.013]
The pattern
This still is filed under Data as proof.
Define
A chart, map, or count that is the argument, not an illustration next to the argument.
Mechanism
Sighted evidence. The reader is asked to believe their eyes: a bar, a share, a spread on a map.
Verdict
The claim is comparative or quantitative and the figure can be read without a caption doing the sell.
Why it works
Colour is spent on ownership and area on volume, so the plate answers two questions - who runs it, how much does it carry - without either encoding interfering with the other. Squares rather than circles let hundreds of symbols sit on a dense network without ambiguous overlap, and printing the number on every square means the graphic never has to be trusted on area judgement alone. The Paris terminals are pulled out into their own panel because they would otherwise set the scale for the whole national map, which is the standard fix for a dataset with one enormous outlier.
Steal this when
Use square proportional symbols coloured by owner when your map has hundreds of points and several competing operators, brands or regions. Pull the one dominant node out into its own inset panel rather than letting it set the scale for everything else.