
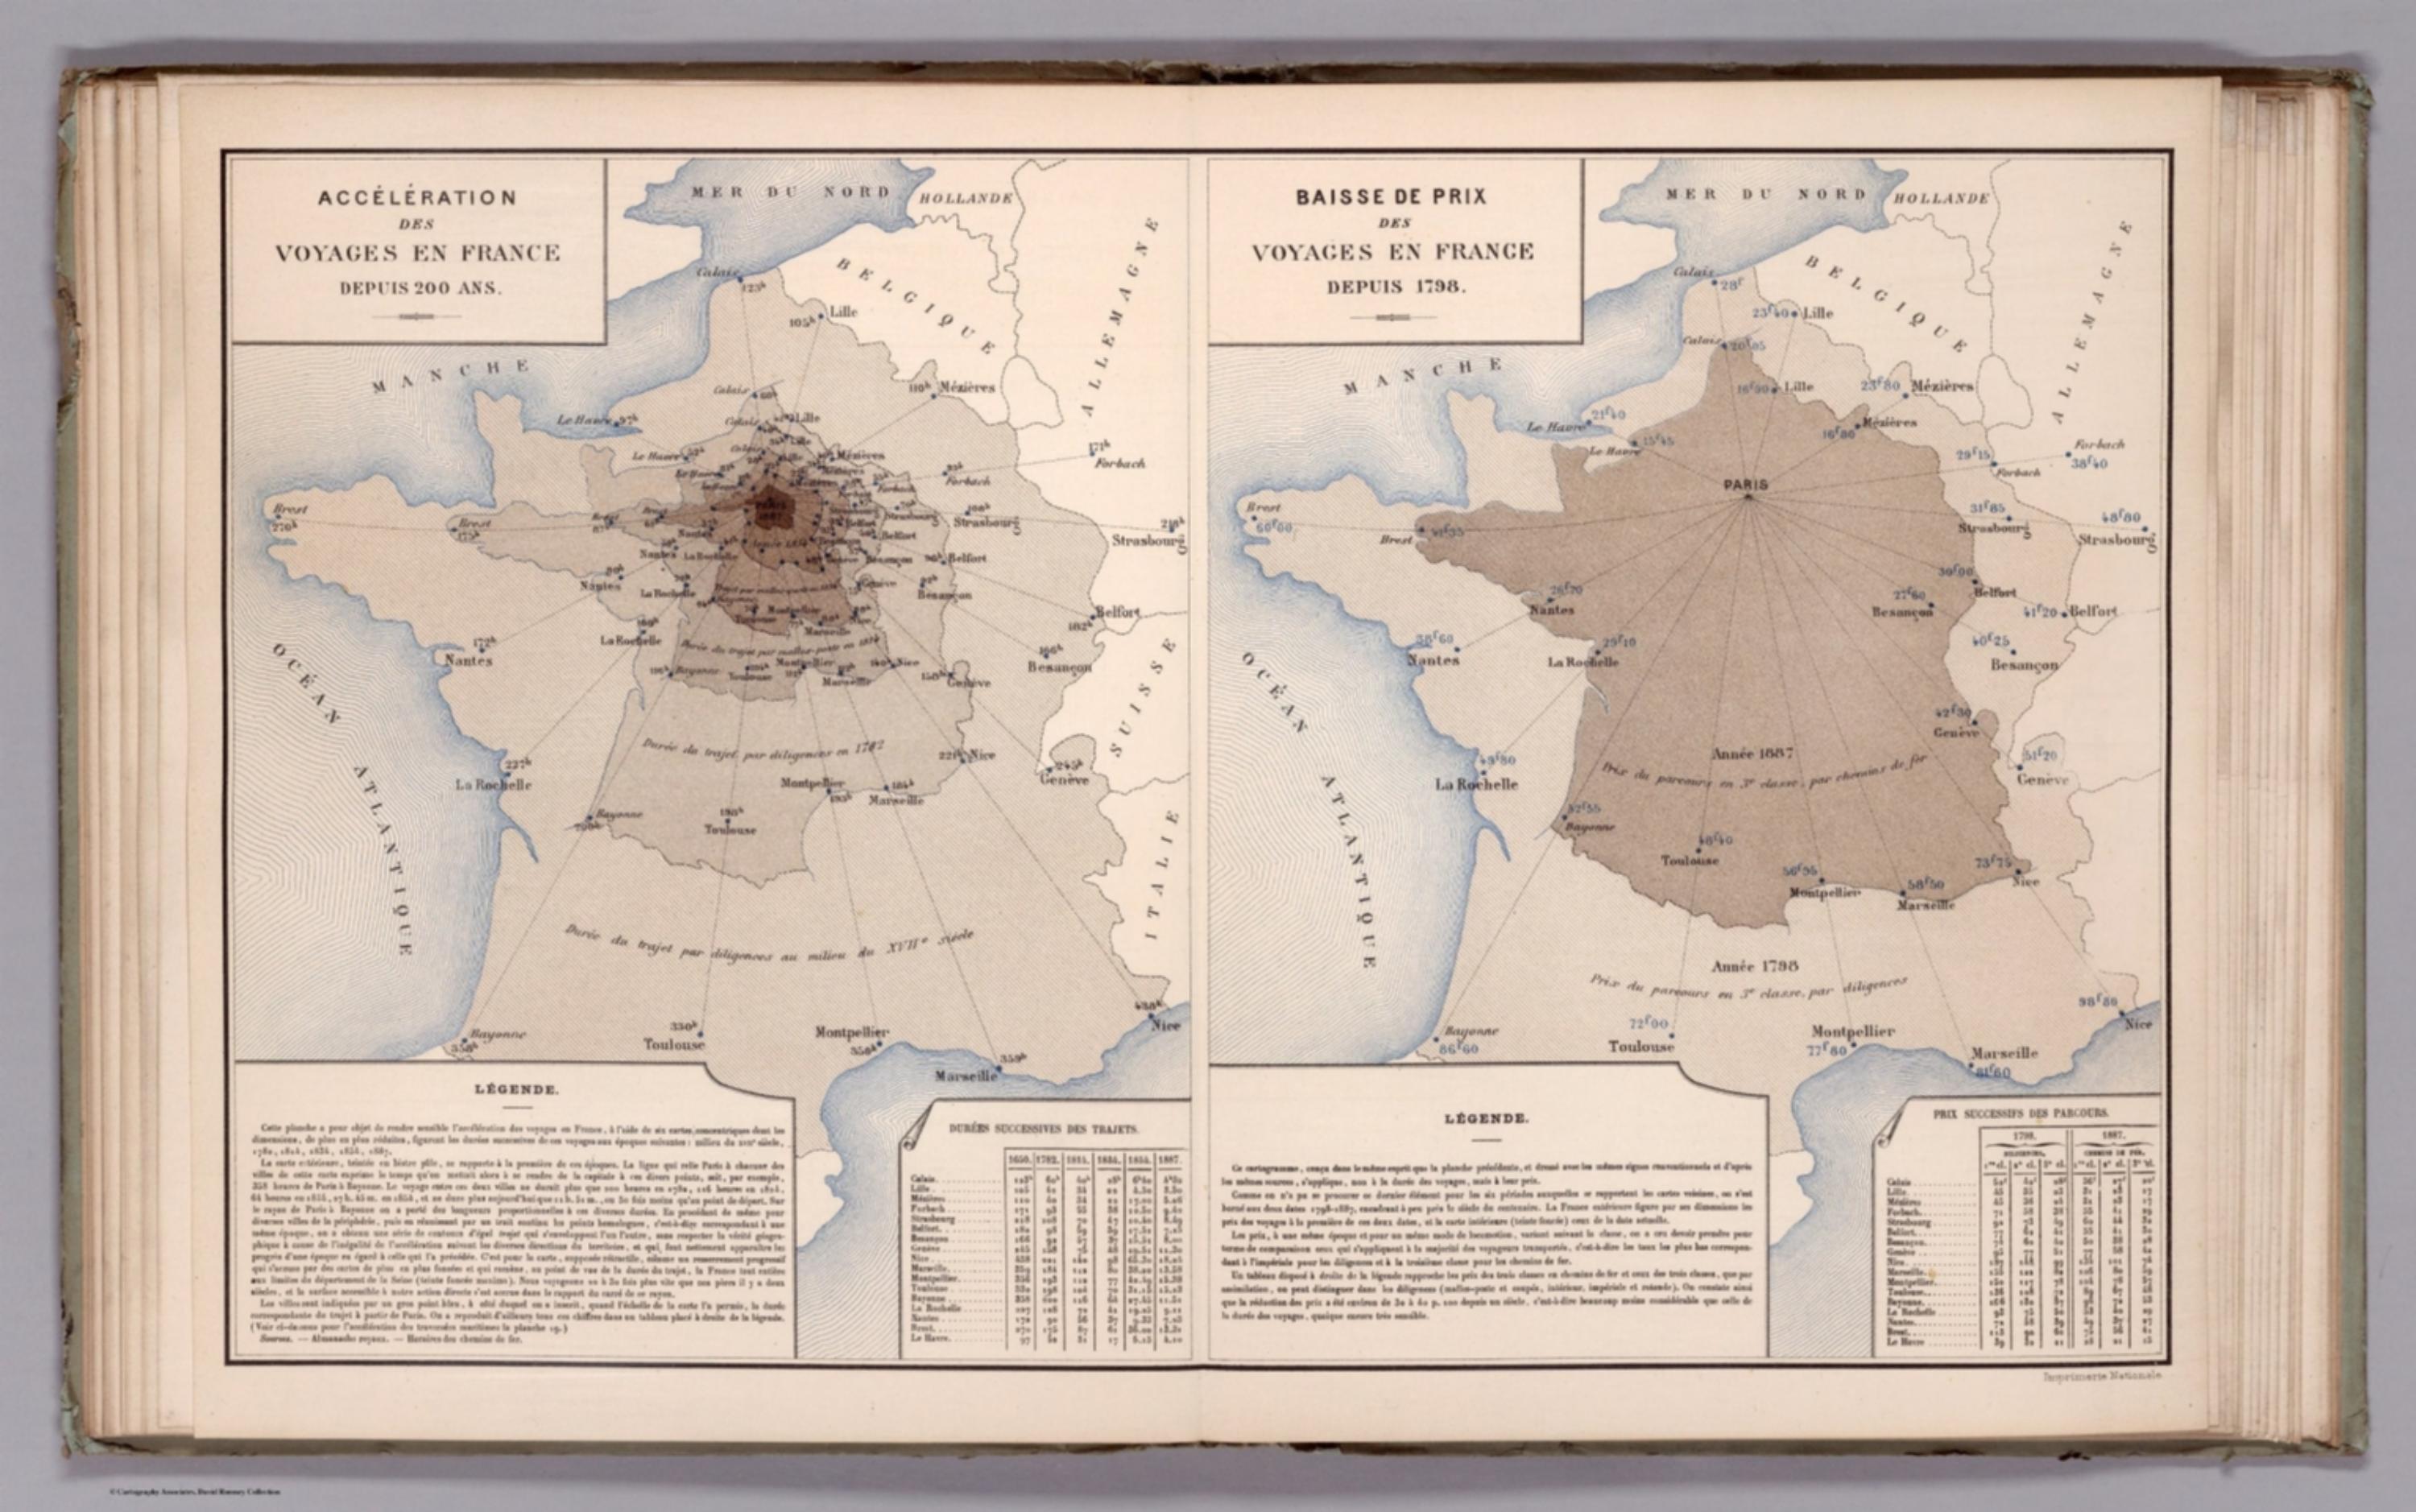
Album de Statistique Graphique - Acceleration des Voyages en France Depuis 200 ans. Baisse de Prix des Voyages en France Depuis 1798. (I. Acceleration of the voyages in France over the past 200 years II. Lower price of the voyages in France since 1798.) [12519.016]
The pattern
This still is filed under Data as proof.
Define
A chart, map, or count that is the argument, not an illustration next to the argument.
Mechanism
Sighted evidence. The reader is asked to believe their eyes: a bar, a share, a spread on a map.
Verdict
The claim is comparative or quantitative and the figure can be read without a caption doing the sell.
Why it works
Distance is re-expressed in the unit the argument is about - hours, then francs - so the reader compares shapes rather than reading numbers, and the conclusion arrives before the caption does. Nesting the periods inside one another turns a time series into a single image of shrinkage, which is far harder to shrug off than a downward line. The two halves use identical construction, framing and typography, so the second map is read in the grammar learned from the first and the two arguments fuse into one. The tables underneath keep the deformation honest, because every outline can be traced back to its city-by-city figures.
Steal this when
Use this when the story is that something got dramatically faster or cheaper over decades and a line chart has stopped landing - redraw the familiar object at the scale of the cost, and nest the eras. Pair two such maps when the same investment bought two separate wins, and keep their frames identical so the reader only has to learn the device once.