
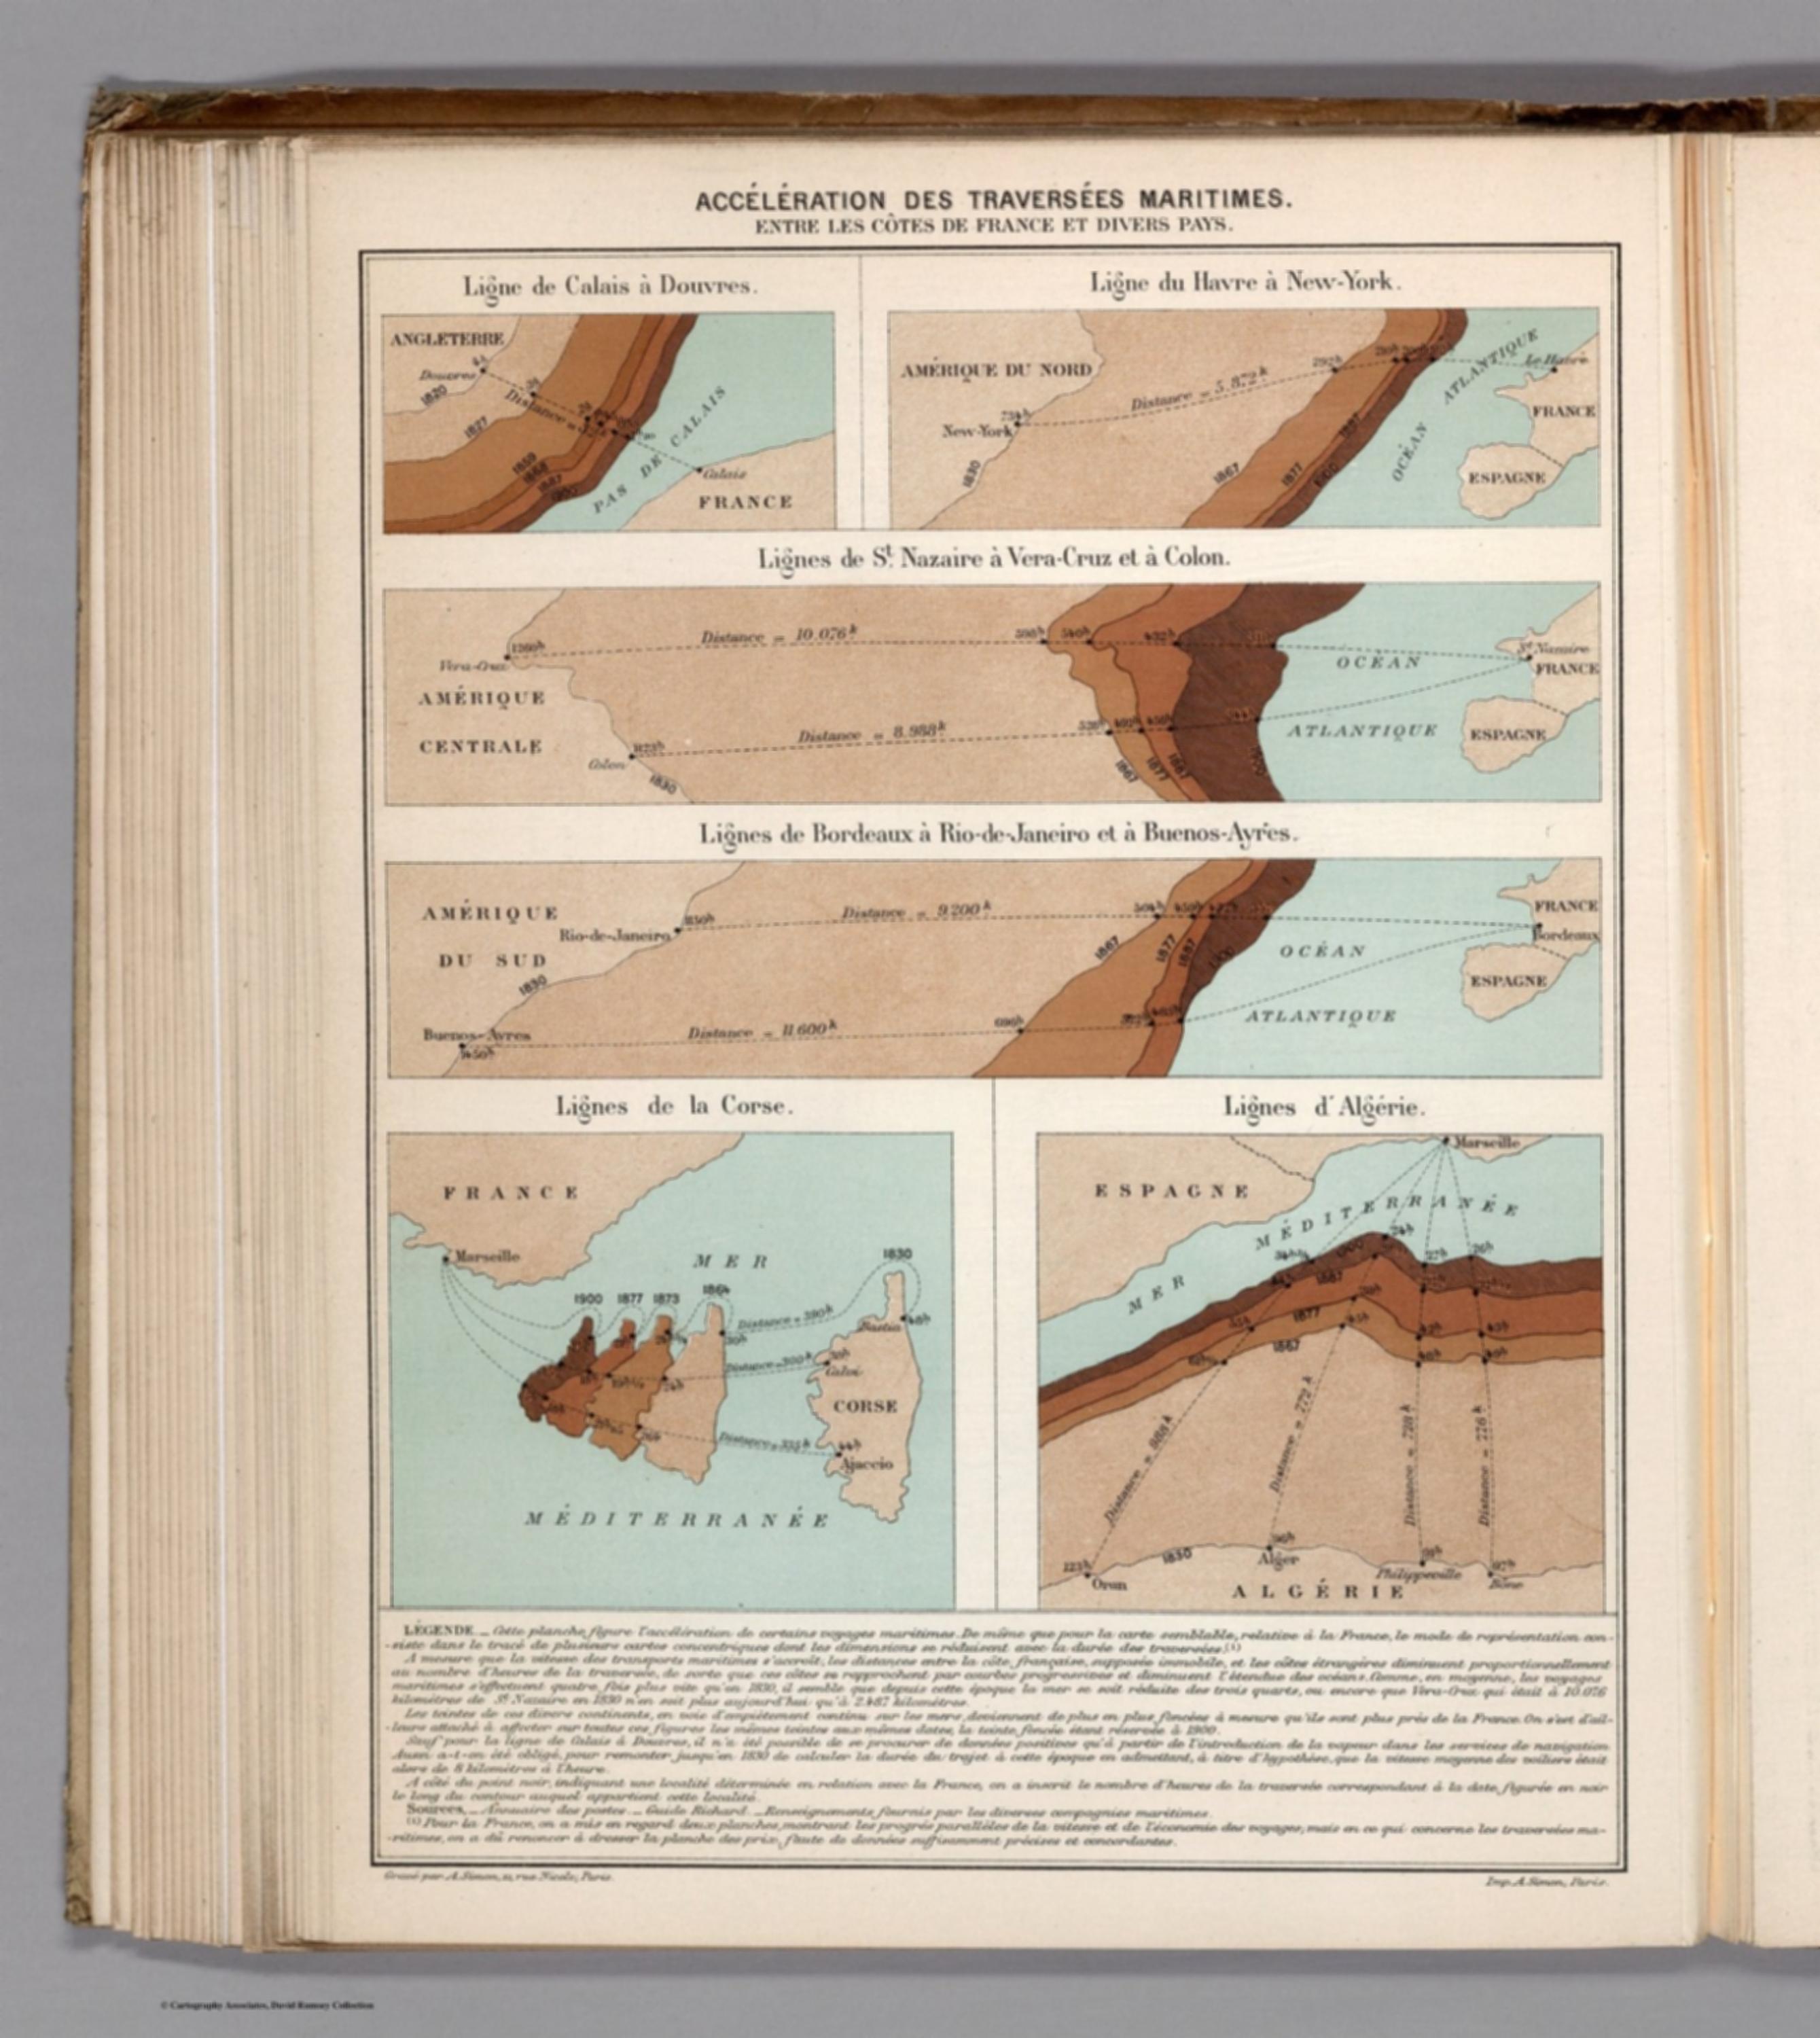
Album de Statistique Graphique - Acceleration des Traversees Maritimes. (Acceleration of Maritime Crossings.) [12526.038]
The pattern
This still is filed under Data as proof.
Define
A chart, map, or count that is the argument, not an illustration next to the argument.
Mechanism
Sighted evidence. The reader is asked to believe their eyes: a bar, a share, a spread on a map.
Verdict
The claim is comparative or quantitative and the figure can be read without a caption doing the sell.
Why it works
It converts a time series into a spatial metaphor the reader feels rather than computes: the abstract claim that a crossing fell from weeks to days is rendered as a coastline physically advancing, which is a visual pun that happens to be dimensionally honest because time is being drawn at a constant speed-equivalent distance. Deepening the brown tint with each newer date gives an ordinal cue independent of the labels, so the direction of progress is readable before any figure is. Repeating one device across six very different routes turns the sheet into a small-multiple argument - the shrinking happens everywhere, which is the point.
Steal this when
Use it when the story is that some cost or delay has collapsed over time and a line chart would be forgettable. Find a physical quantity the audience already feels - distance, weight, floor space - and redraw the world at that equivalent for each date.